


INTRODUCTION
The foot, the most distal body structure in contact with relatively small supporting surface, plays a critical role in maintenance of postural stability during human functional movements [1]. As the only body structure in contact directly with the base of support (BOS), it has complex biomechanical structures consisted of various bones, joints, liga-ments, extrinsic and intrinsic muscles to adapt to the ground surface [2,3]. These biomechanical complexity leads more interdependence among the foot and ankle joints [4,5], and creates various foot postures; the pronated, supinated, and neutral foot types [6]. The ideal neutral foot posture was designed to effectively absorb stresses and release elastic en-ergy during the locomotion by triplanar motion such as pronation and supination [7]. It is therefore important to understand that even a slight structural alteration in a single joint of the foot might influence on the entire foot posture and its unique locomotor functions [5].
The pronated foot posture, a common foot deformity with a rearfoot eversion, dorsiflexion, and forefoot abduction, has strong correlation with low height of medial longitudinal arch (MLA) [8]. Previous study has reported that the collapse of the MLA was related to the dysfunction of the intrinsic foot muscles (IFMs) including flexor digitorum brevis (FDB) and abductor hallucis (AbH) which stabilize the MLA and control triplanar motion of the foot [9]. The pronation deformity causes more mechanical disadvantage by compensation and fatigue of passive and active structures of the foot, thus it closely linked to overused musculoskeletal injuries of the lower extremity than a neutral foot posture [10]. Angin et al. [11] have found a correlation between foot alignment and thickness of IFMs [11] and a few previous studies [10-12] supported the result that pronated foot affects the IFMs, causing attenuated muscles thickness. A decrease in the thickness of the IFMs may lead to increase fatigue in the foot and functional damage [13], as well as loss of structural support and motor control for the MLA [14]. Furthermore, Zhang et al. [15] has found that larger cross-sectional area (CSA) and thickness of AbH correlated to smaller sway of center of pressure (COP) during single-leg standing, additionally FDB also contribute to body balance by support AbH. However, previous study has showed that there was no difference in the CSA of the AbH and FDB between pronated foot group and neutral foot group [9]. Therefore, it is necessary to determine whether the morphology of IFMs plays an important role in balance performance.
Even in the absence of bony deformity, continuous stress such as obesity, repetitive micro-injuries, and inappropriate stimulation could distort foot alignment and cause pronated foot [16]. A pronated foot changes the contact area of the foot with the ground, and decreases the ability to balance the body than that of a neutral foot is seen [17]. These results could be considered as a dysfunction of proprioception system in the IFMs to percept foot position information and foot alignment on various surface [18,19]. In addition, previous studies have shown that altered proprioception system of the foot leads to changes in muscle activation and somatosensory input to maintain postural stability [1,20]. Induction of pronated foot would affect the body's ability to balance, requiring greater effort to maintain postural stability than neutral foot [21]. Therefore, the pronated foot is highly vulnerable to fatigue compared to neutral foot and exposed to various potential risk factors due to reduced dynamic posture stability.
Although numerous studies have reported the differences in postural stability and IFMs thickness according to foot posture, however their correlations are not well known. In addition, total score of FPI-6 scale is mainly used to evaluate several foot postures in the previous studies, however little has been investigated which component of FPI-6 scale is most relevant to changes in postural stability and IFMs thickness. Thus, current study aimed to investigate the correlation of features of foot posture with IFMs thickness and balance ability. We hypothesized that individuals with a pronated foot posture show thinner IFMs, and they also likely have attenuation of dynamic postural stability than individuals with a neutral foot.
METHODS
1. Participants
A total of forty-one male participants aged 18 to 30 years were involved in the present study, after ruling out two male volunteers based on exclusion criteria (Fig. 1). The exclusion criteria were visual or vestibular issues, history of previous ankle sprain, musculoskeletal pain or history of medical problems in the lower extremity within the past six months, previous experience of specific balance training, and medicine taken within the last 48 hours. All participants were briefed about the experimental procedures and signed the informed consent prior to their participation. The rights and safety of the study participants were pro-tected during the whole experimental procedure and the study was ap-proved by the Institutional Review Board of the College of Health and Welfare, Woosong University (approval No. 1041549-210413-SB-118).
Fig. 1.
Fig. 1.Experimental scheme of current study. Foot posture was assessed by FPI-6 score, thickness of IFMs was measured by ultrasound imaging and dynamic posture stability was evaluated by BBS test.
FPI-6, Foot Posture Index-6; BBS, Biodex Balance System; OSI, overall stability index; APSI, anterior-posterior stability index; MLSI, medial-lateral stability index.

2. Instrumentation
1) Foot Posture Index (FPI-6)
The FPI-6, a clinical visual assessment tool designed by Redmond [6], is a simple and efficient method to quantify the foot posture alignments in numerical scores. The FPI-6 has been shown both high intra-rater (ICC=.89-.96) and inter-rater reliabilities (ICC=.85-.86) regardless of re-searchers’ experience level [22,23]. It is consisting of six visual criteria to measure foot pronation and supination in three anatomical body planes [24]. The six clinical criteria include [25]: 1) position of the talar head (FPI 1), 2) curvatures above and below the lateral malleolus (FPI 2), 3) inversion and eversion of the calcaneus (FPI 3), 4) prominence in the area of talonavicular joint (FPI 4), 5) congruence and height of the medial longitudinal arch (FPI 5), 6) abduction and adduction of the forefoot on the rear foot (FPI 6) (Table 1). Each assessment criterion was simply graded using 5-point Likert-type scale from −2 to +2: −2 for significant signs of supination, 0 for neutral, and +2 for signs of pronation [26]. The foot posture types were determined by total score of six criteria: −12 to −5 (extremely supinated foot), −4 to −1 (supinated foot), 0 to +5 (neutral foot), +6 to +9 (pronated foot), and +10 to +12 (extremely pronated foot) [24].
Table 1.
Detailed description of FPI-6 assessment and its subdomains
TNJ, Talo-Navicular Joint. This table is derived from the previous study by Redmond et al. [6].
2) Ultrasound imaging
The ultrasonography is safe and commonly used in clinical diagnostic tool, also it is capable to produce real-time images by non-invasive meth-od [25]. Many artifacts and objects seen by ultrasound images are measured due to physical properties of ultrasonic beams. Ultrasound imaging has some important component factors such as frequency, interaction of ultrasound with tissue. The units of frequency of ultrasound are hertz, and frequencies that used for clinical investigations are in the 2 MHz to 10 MHz range [26]. The modes of ultrasound are divided into B-mode, M-mode, doppler, and color mode, particularly B-mode is mainly used when observing the musculoskeletal system. In this study images of IFMs were obtained with B-mode ultrasonography (Healcerion sonon series, Korea) using a 7.5 MHz linear probe, each image of the muscles was taken using Sonon software. The assessment of IFMs thickness using the ultrasonography was conducted by a skilled physical therapist who received the ultrasonography training and experienced in musculoskeletal research area. IFMs thickness was measured by three times for each set, obtaining the most appropriate images, and these measurements were repeated in two sets.
3) Biodex Balance System (BBS)
The Biodex Balance System (BBS; Biodex Medical Systems Inc., Shir-ley, NY, USA) is a reliable multiaxial device to quantify balance ability by standing on the freely moving foot platform [26]. The instability of foot platform varies according to the preset level (most stable: level 12; most unstable: level 1), and maximally allows a foot platform tilt up to 20˚ in all directions [27,28]. The BBS shows one's postural stability into score of three indices: overall stability index (OSI), anterior-posterior stability index (APSI), and medial-lateral stability index (MLSI) [26]. We referred to previous study to compose BBS protocol [29,30]. Also, we used level 6 for 20 seconds on each trial with 10 second intervals and take a minute rest between the eyes opened and closed conditions.
3. Procedures
First, the general information data was recorded including the partici-pant's dominant foot. Body composition was measured via Inbody 120 Body Composition Analyzer (Biospace Co. Ltd., Seoul, Korea). Also, participants with foot and ankle pain within the last 3 months were excluded through an oral questionnaire. The examination was performed in the order of FPI-6, Ultrasound, and BBS test to prevent muscles from being affected by using it. Foot posture of each participant was measured by FPI-6 score by same researcher. To assess their anatomical structure of foot precisely, FPI-6 was carried out on a bench, hence aligning the eye level of the investigator with the foot of the participants. The subjects were instructed to stamp their feet several times and then stopped in re-laxed standing position. For measuring the ultrasound image of IFMs, the participants were positioned in a sitting posture with their foot in a non-weight bearing position. And the investigator held the participants’ ankle positioned in a slightly dorsiflexion. This position was chosen not only to maintain the similar condition of the foot and ankle's angle in weight-bearing positions but also to make measurement less difficult when the foot contacts with the ground [31]. Ultrasound images of each muscle were acquired three times each during two sets of measurements by the same investigator. Finally, the most appropriate image was selected, and then average value of muscle thickness was measured and used from each IFMs image. To locate the probe position of the IFMs, the recom-mendations described by Crofts was followed [32]. The thickness of FHB, FDB and AbH was measured at the thickest part of each muscle followed by the proper position for manual measurement (Fig. 2). In order to measure the dynamic posture stability, each participant was requested to stand on the BBS moving platform with a single leg stance and evaluated in the dynamic state (level 6). Participants were also required engage in the test with both conditions with their eyes were opened and closed. Each test was carried out three times for 20 seconds with 10 second intervals. To minimize errors, there were also 1-minute breaks between the conditions where the participants either had their eyes opened or closed. Postural control could be compensated by visual sensory, thus it might be considered that dynamic stability without visual information is the more adequate task difficulty for identifying a significant difference of postural stability according to foot posture.
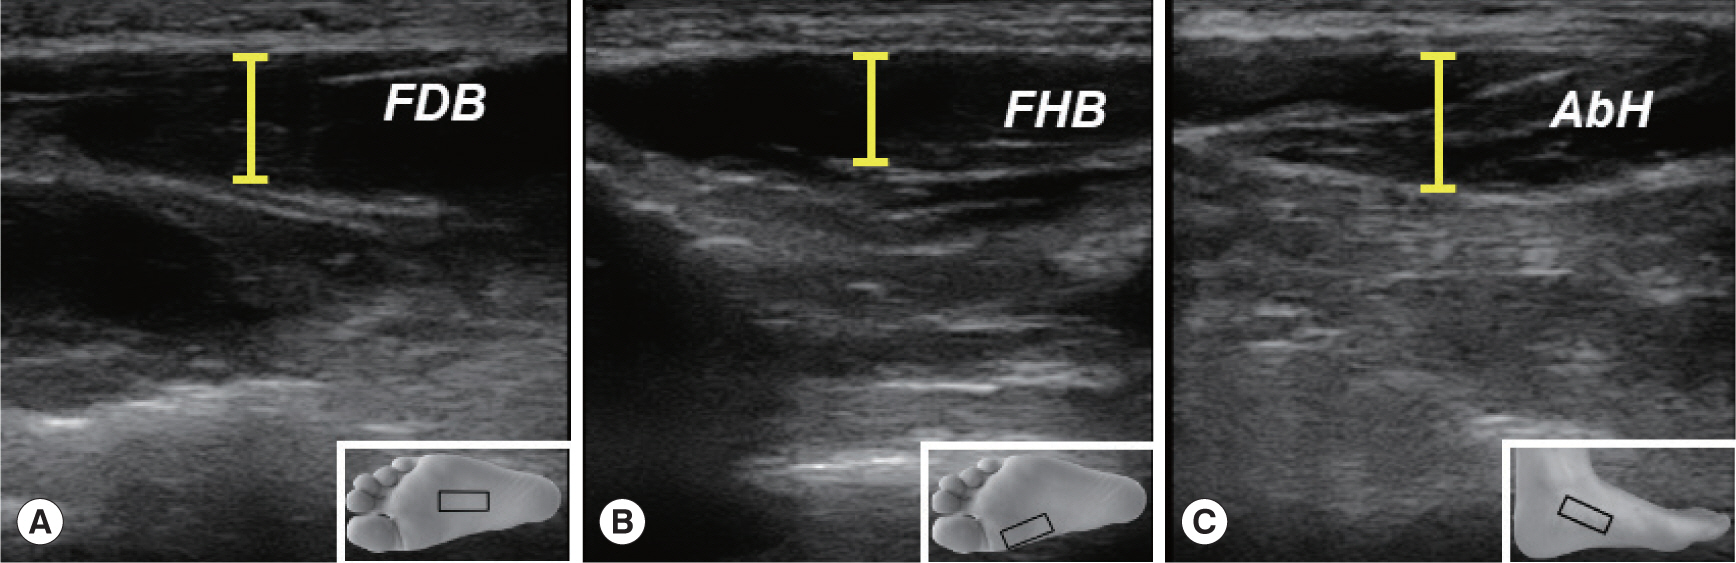
Fig. 2.
Fig. 2.Measurement of IFMs thickness by Ultrasound imaging. (A) Flexor Digitorum Brevis (FDB); The probe was placed along the line from the medial tu-bercle of the calcaneus to the 3rd toe and measures the thickest part of the muscle. (B) Flexor Hallucis Brevis (FHB); The line is drawn from the shaft of the 1st metatarsal to the medial side of calcaneus. The probe scanned the muscle through this line and measured the thickest part of the muscle. (C) Abductor Hallucis (AbH); The thickest part of the abductor hallucis could be measured on the line between navicular tuberosity and the medial calcaneal tuberosity, which is the muscle's origin.
4. Statistical analysis
A non-parametric method was used to analyze the statistical data of the present study. The differences of IFMs thickness and postural stability between neutral and pronated foot groups were analyzed using Mann-Whitney U-test. Spearman correlation coefficients were applied to verify the correlation between the foot posture and both IFMs thickness and postural stability parameters. Additionally, the reliability coefficient of IFMs thickness using ultrasound imaging was analyzed by in-traclass correlation coefficient statistics (ICC 3,1; two-way mixed effects model, single measurement type defined in absolute agreement). All statistical data analyses were performed using the IBM SPSS Statistics ver. 27 (IBM Corp., Armonk, NY, USA), and statistical significance was set at p <.05.
RESULTS
1. General characteristics of the participants
A total 41 healthy male participants aged 18 to 30 were included in this study, the analysis of general characteristics and body composition factors of each group are shown in Table 2. There were no significant differences between the neutral and pronated foot groups. WHO defined the standard of obesity in the Asia-Pacific region as a BMI of 25 kg/m2 or higher. Based on this criteria, BMI of the neutral and pronated foot group was 24.25±3.55 kg/m2 and 25.86±3.65 kg/m2 in this study, respectively. Although all body composition factors including weight were higher in pronated foot group compared to neutral foot group, it was not significantly different in this study. Thus, it was thought that body composition factors did not affect foot posture in current study. Detailed descriptions of FPI-6 score in both groups were shown in Table 3, and the average of total FPI-6 score of neutral and pronated foot group was 3.05±1.36 and 7.40±1.43, respectively. Besides, all six items of FPI-6 showed statistical significances between the groups (p <.01), which indi-cated the distinct characteristics of the pronated foot.
Table 2.
General characteristics of the participants (n=41)
Table 3.
Description of FPI-6 score in neutral and pronated foot groups (n=41)
| Parameters | Neutral (n=21) | Pronated (n=20) | Z | p-value |
|---|---|---|---|---|
| TH | 0.62±0.59 | 1.45±.51 | -3.857 | .000** |
| Curvature | 0.57±0.51 | 1.25±.55 | -3.464 | .001** |
| Calcaneus | 0.29±0.46 | 0.90±.64 | -3.107 | .002** |
| TNJ | 0.62±0.59 | 1.30±.57 | -3.262 | .001** |
| MLA | 0.43±0.51 | 1.15±.49 | -3.797 | .000** |
| Forefoot | 0.52±0.60 | 1.35±.59 | -3.680 | .000** |
| Total FPI-6 | 3.05±1.36 | 7.40±1.43 | -5.525 | .000** |
TH, Talar head palpation; Curvature, Supra and infra lateral malleolar cur-vature; Calcaneus, Calcaneal frontal plane position; TNJ, bulging in the region of the Talo-Navicular Joint; MLA, height and congruence of the Medial Longitudinal Arch; Forefoot, abduction/adduction of the Forefoot on the rearfoot.
2. The differences of dynamic posture stability between neutral and pronated foot groups
Evaluation of dynamic posture stability using BBS experiment was conducted under the two conditions in current study; eyes opened and closed. No significant difference was observed between the neutral and pronated groups with the eyes opened condition (p>.05). However, there were significant differences between both groups under the eyes closed condition. All three types of stability indices were significantly different; APSI (neutral foot group: 3.23±1.32, pronated foot group: 4.43±1.38, p<.01), MLSI (neutral foot group: 4.39±2.04, pronated foot group: 5.21±1.56, p<.05) and OSI (neutral foot group: 6.07±2.45, pronated foot group: 7.68±1.83, p <.01) are shown in Table 4. We also analyzed the changes in the postural stability indices between eyes opened and closed conditions to compare the differences of postural sway between both groups. Pronated foot group had greater changes in postural stability than the neutral foot group, showing significant differences in APSI (neutral foot group: 2.23±1.30, pronated foot group: 3.07±1.14, p <.05) and OSI (neutral foot group: 3.61±2.22, pronated foot group: 4.51±1.99, p<.05). However, there was no significant difference in MLSI (neutral foot group: 2.38±1.98, pronated foot group: 2.65±1.94, p>.05).
Table 4.
Comparison of dynamic posture stability between neutral and pronated groups (n=41)
| Parameters | Neutral (n=21) Pronated (n=20) | Z | p-value | |
|---|---|---|---|---|
| Eyes opened | APSI | 1.00±0.46 1.36±0.73 | -1.847 | .065 |
| MLSI | 2.01±0.88 2.56±1.17 | -1.855 | .064 | |
| OSI | 2.45±0.92 3.17±1.25 | -1.920 | .055 | |
| Eyes closed | APSI | 3.23±1.32 4.43±1.38 | -2.846 | .004** |
| MLSI | 4.39±2.04 5.21±1.56 | -1.970 | .049* | |
| OSI | 6.07±2.45 7.68±1.83 | -3.053 | .002** | |
| Differences | APSI | 2.23±1.30 3.07±1.14 | -2.167 | .030* |
| (Eyes closed- | MLSI | 2.38±1.98 2.65±1.94 | -1.371 | .170 |
| Eyes opened) | OSI | 3.61±2.22 4.51±1.99 | -2.022 | .043* |
3. The correlation between subdomains of FPI-6 and dynamic posture stability
To identify whether the change of foot posture is related to balance ability, we analyzed the correlation between subdomains of FPI-6 and balance ability (Table 5). In eyes opened condition, a significant correlation was found between MLA and APSI (R=0.311, p <.05). There were also significant associations under the eyes closed condition. It revealed that TH (R=0.356, p <.05), MLA (R=0.333, p <.05) and Total FPI-6 score (R=0.385, p <.05) had a significant relationship with APSI, respectively. In addition, TH (R=0.372, p <.05), Calcaneus (R=0.328, p <.05), MLA (R=0.337, p <.05) and Total FPI-6 score (R=0.449, p <.01) also significantly associated with OSI, respectively. In other words, these FPI-6 subdomains and APSI, OSI showed positive linear relationships, which means that postural instability index increased as the foot is pronated.
Table 5.
Correlation between the subdomains of FPI-6 and dynamic posture stability (n=41)
| Parameters | Eyes opened | Eyes closed | |||||
|---|---|---|---|---|---|---|---|
| APSI | MLSI | OSI | APSI | MLSI | OSI | ||
| TH | 0.117 | -0.020 | -0.035 | 0.356* | 0.240 | 0.372* | |
| Curvature | 0.038 | 0.187 | 0.144 | 0.144 | 0.086 | 0.188 | |
| Calcaneus | 0.154 | 0.147 | 0.139 | 0.306 | 0.242 | 0.328* | |
| TNJ | R | 0.122 | 0.155 | 0.194 | 0.150 | 0.212 | 0.232 |
| MLA | 0.311* | 0.056 | 0.105 | 0.333* | 0.210 | 0.337* | |
| Forefoot | 0.040 | 0.078 | 0.022 | 0.163 | 0.213 | 0.280 | |
| Total FPI-6 | 0.214 | 0.163 | 0.163 | 0.385* | 0.301 | 0.449** | |
4. The comparison of IFMs thickness between neutral and pronated foot groups
To figure out the difference of IFMs thickness according to foot posture, we measured the thickness of IFMs using ultrasound imaging, in particular FDB, FHB and AbH which are related to foot arch. There were no significant differences in IFMs thickness between neutral and pronated foot groups (Table 6). To determine the reliability of ultrasound imaging on IFMs, ICC (3,1) value was analyzed for each muscle; FDB was 0.923, FHB was 0.976 and AbH was 0.963.
5. The association between the subdomains of FPI-6 and IFMs thickness
In analysis of correlation between foot posture and IFMs thickness, there were significant correlations between FPI-6 subdomains and IFMs thickness (Table 7). The significant negative correlations were found between TNJ and FDB thickness (R=-0.311, p <.05), as well as between forefoot and FHB thickness (R=-0.327, p <.05). These results present that score of FPI-6 subdomains and thickness of IFMs, particularly FDB and FHB, have an inverse relationship, suggesting pronation of foot is related to reduction of thickness of these muscles. However, AbH thickness were not associated with any subdomains of FPI-6.
DISCUSSION
Foot is a complex structure in contact directly with the ground, therefore, even small biomechanical alterations might influence both foot posture and postural stability. Particularly, the IFMs have a crucial role in the maintenance of foot posture, however their interactions still re-main unclear. Therefore, the aim of present study was to investigate whether foot posture such as pronated foot is associated with changes in IFMs thickness and postural stability. No significant differences were observed in the general characteristics between neutral and pronated foot groups (Table 2), in particular the body composition factors did not show the considerable differences between the groups. Obesity is one of the risk factors that reduce MLA and lead pronated foot [33], however in this study, there were no significant differences in body composition factors enough to affect pronated foot caused by obesity. Also, there were no significant differences in IFMs thickness between both types of foot posture. However, our results showed that subjects with a pronated foot had greater dynamic postural instability in eyes closed condition compared to those with a neutral foot. Additionally, it was demonstrated that some of subdomains in FPI-6 had significant positive correlations with postural stability indices, while significant negative correlations with IFMs thickness. It indicates that dynamic postural stability and IFMs thickness such FDB and FHB are reduced as the features of pronated foot become stronger.
1. Alteration of dynamic posture stability by foot posture
Postural balance is integrated by several types of sensory information, including visual sensory, vestibular sensory, and somatosensory such as position sense [34]. Somatosensory in the foot is particularly critical for postural stability, thus the change of foot posture such as pronated foot can influence balance control ability [35]. In this study, we compared the dynamic posture stability between pronated and neutral foot groups to determine whether there is a difference in dynamic posture stability de-pending on the foot posture. As with the results of the previous study [1], the change in postural stability was identified in pronated foot group. Pronated foot group showed poor dynamic posture stability compared to neutral foot group, and these differences between the groups were significant in eyes closed condition (APSI and OSI: p <.01, MLSI: p <.05). In addition, the differences in dynamic postural indices stability between eyes opened and closed conditions was found to be considerably greater in the pronated foot group than neutral foot group (APSI and OSI: p <.01), which indicating pronated foot group might have increased dependence on visual feedback. These results provide the evidence that individuals with a pronated foot showed increased instability in balance assessments as compared to those with a neutral foot, especially when visual feedback was limited. As previous study has shown similar result [12], these results suggest that individuals with a pronated foot has a greater reliance on visual feedback to maintain balance as evidenced by their greater instability during the balance test with eyes closed. This highlights that, as the body compensates other systems for instability, it becomes increasingly dependent on visual feedback to sustain balance [7]. Therefore, we could consider the use of visual blocks when assessing potential balancing ability in participants with pronated foot. However, it remains unclear how much more individuals with a pronated foot rely on visual feedback to maintain postural stability, and how it affects the change in overall posture. Thus, further study using a variety of meth-odologies is needed to fully comprehend the changes in balance in individuals with a pronated foot, and to determine the role of different feedback systems in maintaining balance in this population.
2. Correlation between foot posture and dynamic posture stability
Foot posture contributes to maintaining the body's BOS relative to the ground [36]. Foot posture could be changed with alterations in foot structure due to various risk factors and long-term stress. Thus, we investigated which component of FPI-6 scale is most connected with postural instability. In current study, we detected that pronated foot was significantly related to dynamic posture stability. Moderate significant correlations were found in both eyes opened and closed conditions; Particularly with eyes closed condition, APSI was significantly associated with TH (R=0.356, p <.05), MLA (R=0.333, p <.05) and Total FPI-6 score (R=0.385, p <.05), and OSI also was significantly related to TH (R=0.372, p <.05), Calcaneus (R=0.328, p <.05), MLA (R=0.337, p <.05) and Total FPI-6 score (R=0.449, p <.01), respectively. These FPI-6 subdo-mains and indices of postural instability showed the positive linear correlations, these results revealed that postural stability is deteriorated as the foot is pronated. When the vision was blocked, more subdomains of FPI-6 were involved in the correlation with the indices of postural instability compared to eyes opened condition. Similar to our results, previous study also demonstrated that pronated foot posture was correlated with attenuated dynamic postural stability under eyes closed condition [3]. It seems individuals who have pronated foot would be more dependent in other sensory system which correlated with balance ability [1].
Among FPI-6 items, MLA was the only component that showed the most significant relationship with postural instability in both eyes opened and closed conditions in this study. In Table 5, MLA was significantly linked with dynamic APSI under the eyes opened (R=0.311, p <.05) and closed (R=0.333, p <.05) conditions. These results indicate that postural instability in AP direction was significantly increased as the height of MLA was decreased. It is reported that MLA is a pivotal component associated with the pronated foot posture [8], also its reduced height was strongly related to the dysfunction of the IFMs [9]. Ac-cording to the previous study, the increased contact area of MLA caused by navicular bone drop would induce the activation of IFMs to make neutral position of MLA [37], consequently it might follow with overuse injuries of IFMs [10]. Therefore, IFMs exposed to fatigue could cause dysfunction of the foot sub-system to maintain a neutral foot, ultimately affecting the maintenance of BOS. Meanwhile, previous study demonstrated that the area of the MLA was associated with the postural stability parameters in AP direction in healthy subjects [38]. Similar to this result, we also confirmed that MLA was significantly related to APSI, rather than MLSI in present study. MLA, which plays a critical role in shock absorption and propulsion of the foot while walking, is formed by the anterior and posterior pillars; Anterior pillar is made up of the medial three metatarsal heads, and the tuberosity of the calcaneus comprise the posterior pillar [39,40]. Through these anatomical features, MLA is thought to be related to posture stability in AP direction, however there are few studies that have investigated their correlation separated into the AP and ML direction in the foot. Further research is therefore needed to determine postural stability in various direction related to IFMs dysfunction and change of foot posture with a larger sample size.
3. Correlation between foot structure and IFMs thickness
Although there were no significant differences in IFMs thickness between the groups in this study, we found that individual items of FPI-6 scale were negatively correlated with thickness of FDB and FHB, respectively. TNJ was significantly associated with thickness of FDB (R=-0.311, p <.05), as well as forefoot abduction was significantly correlated with FHB thickness (R=-0.327, p <.05). Consequently, the thickness of the FDB was decreased as the TNJ was dropped, and FHB thickness was reduced as the forefoot was abducted in the FPI-6 assessing the foot posture. The drop of the TNJ and forefoot abduction can be explained by the altered biomechanical stresses, and functional demands placed on these muscles due to the changes in foot posture [41]. TNJ drops and forefoot abduction can indicate a collapse or flattening of the MLA in the foot [10-13]. A previous study reported that when the FDB becomes thicker, the second, third and fourth metatarsal heads are raised more [42], which could interpret as higher MLA. Therefore, this result indi-rectly supports the MLA height gets lowered as FDB becomes thinner. Whereas, some of the previous studies have seen no difference or thicker in IFMs thickness with pronated foot [9,43]. We assume that these con-flicting results are compensations manifesting as greater activation in other structures due to weakening of some structures supporting MLA. Since there are not enough studies on the compensatory action of muscles to support the pronated foot caused by weakening of the IFMs, thus further research and interpretation on this are needed to identify the correlation between the changes of foot posture and muscular structures.
This study has a few limitations. First, this study was conducted only on healthy male subject aged 18 to 30 years, therefore it is difficult to generalize to subjects of different ages, and the sample size per group is also not sufficient. Additionally, it could be possible that the factor such as effect of practice on BBS experiment due repeated performance may have affected the measurement of dynamic posture stability. Thus, we organized the BBS experiment with both conditions of eyes opened and closed to adjust the difficulty for measurement of dynamic posture stability. Although it was measured based on published methods in the process of confirming IFMs thickness using ultrasound, however there might be a difference in the pressure on probe during measurement. To reduce this measurement error, therefore ICC (3,1) value representing the reliability for each IFMs was analyzed and confirmed as follows; FDB was 0.923, FHB was 0.976 and AbH was 0.963. Finally, we focused only on the relationship between the pure thickness of IFMs and foot posture and did not consider the effect of weight on the thickness of IFMs in present study. Since IFMs are expected to be heavily influenced by weight, further studies would be needed to examine whether the thickness of IFMs changes in the weight bearing position, and it affect the functions of foot.
CONCLUSION
In this study, we have divided the foot posture into both pronated and neutral foot groups using FPI-6 scale in the randomized subjects, then dynamic postural stability and IFMs thickness were measured and compared, respectively. As a result, we confirmed that poor postural stability was shown in the pronated foot group, also these features of pronated foot are significantly associated with dynamic postural instability. Individuals with a pronated foot showed thinner IFMs thickness than neutral foot group, however there were no significant differences. Despite of, IFMs thickness was significantly associated with the features of pronated foot, especially negative correlations were found between FDB and TNJ, and FHB and forefoot abduction. These results suggest that alteration of foot posture such as pronated foot could influence the postural control ability and IFMs thickness. Simultaneously, since the changes in the IFMs thickness could affect the MLA height, it has clinical importance to understand their interrelationships to prevent postural instability such as falling down. Moreover, further studies would be needed to compare the EMG activities among IFMs, extrinsic foot muscles and muscles of lower extremity regarding on the weight bearing position or diverse foot postures, as well as to examine the effect of visual feedback on various foot postures.


