| Home | E-Submission | Sitemap | Contact Us |  
Exerc Sci > Volume 33(1); 2024 > Article
Kim, Kim, Kim, and Ma: Health-related Physical Fitness, Blood Pressure, and Body Mass Index among People with Intellectual Disability, Visual Impairment, and Hearing Impairment

Abstract

PURPOSE

A low physical fitness level is one of the major health problems to be addressed among people with disabilities; this issue has not been spotlighted much in the public. This study was performed to determine the health-related physical fitness (HRPF) and blood pressure of people with intellectual disability (ID), visual impairment (VI), and hearing impairment (HI) and the differences in these parameters according to each type of disability and its severity.

METHODS

Data of 11,802 participants with ID, VI, and HI who underwent standard physical fitness tests were analyzed. Differences in the proportion of participants with high blood pressure (HBP), body mass index (BMI) group, and HRPF parameters according to the severity of each type of disability were analyzed using the χ2 test or one-way analysis of variance. The odds ratio for HBP after adjustments for age, sex, severity of disability, and BMI group was also analyzed using multiple logistic regression analysis.

RESULTS

There were significant differences in all HRPF parameters according to the disability type as well as the severity of disability in each group of individuals with ID, VI, and HI. Those with ID had the lowest values in the hand grip strength, sit-up, and sit-and-reach tests, and these values were significantly lower in the most severely disabled group for individuals with ID. The odds ratio for HBP was 1.211 (95% confidence interval: 1.069–1.371) for grade 1 ID.

CONCLUSIONS

Participants with ID had generally lower HRPF parameter values than those of participants with VI and HI. In addition, significant differences in HRPF parameter values, the proportion of participants with HBP, and BMI were found among participants with disabilities according to the severity of their disability, indicating opportunities for improving the health in these groups.

INTRODUCTION

People with disabilities experience limitations in performing day-to-day activities which lead to many related health problems [1]. With the registered number of Korean people with disabilities in 2021 being over 2.6 million (about 5% of total population), and 32.6% of them having severe grade disability [2], their healthcare should not be overlooked.
Physical fitness is a set of attributes or characteristics that is defined based on one’s ability to perform physical activities. Cardiopulmonary capacity, muscular strength and endurance, flexibility, and body composition are considered to be key components of health-related physical fitness (HRPF), which are related to good health and execution of everyday tasks [3]. Physical fitness of people with disabilities has been assessed since 2018 by the standard protocols according to their type of disabilities, which the Korea Sports Promotion Foundation and the Korea Paralympic Committee had developed [4] to promote health by encouraging their participation in sports (https://nfa.koreanpc.kr/).
Previous studies have reported high prevalence of obesity and low fitness levels among people with disabilities [2,5-7]. Although it can be assumed that people with severe disabilities would have lower fitness levels due to lack of independence and self-controllability leading to physical inactivity and nutritional imbalance, evidence to prove this is lacking. In addition, since subsequent susceptibility to metabolic and cardiovascular diseases threatens their health, physical fitness of the severely disabled should be improved through health-promoting strategies. From the perspective of public health as well as social welfare, it is essential to assess their physical fitness levels and the presence of metabolic diseases such as hypertension.
Therefore, this study was conducted to estimate the level of HRPF of Korean adults with severe disabilities and to determine whether HRPF and the prevalence of hypertension varied according to the severity of disability among each type of disability from the large population database in Korea.

METHODS

1. Data access and participants

Since 2018, the Korea Sports Promotion Foundation and the Korea Paralympic Committee has been assessing the physical fitness of people with intellectual disability (ID), visual impairment (VI), hearing impairment (HI), and disability due to spinal injury following their standardized protocol in 10 certified centers nationwide. We conducted a secondary analysis of their data collected from October 2018 to August 2021, which was acquired from the public platform of cultural big data (www.bigdata-culture.kr), where no personal information of the participants was included. In this study, the data of adults (n =11,970) aged 20–64 years with ID, VI, and HI, whose severity of disability was from Grade 1 to 3 were included based on the Korean Disability Classification System. The data of the subjects who did not undergo all physical fitness tests (n =168) were excluded. Values of outliers (n =268) considered to be input errors were treated as missing values due to potential biases. Ultimately, 11,802 participants were included in the statistical analysis (Fig. 1).
This study was approved by the Institutional Review Board (IRB) of Pukyong National University (1041386-212112-HR-73-02). Informed consent was waived by the IRB owing to the retrospective nature of the study.

2. Measurement of health-related physical fitness parameters

Handgrip strength (HGS) was used to measure the muscular strength of the upper limb using a Smedley hand dynamometer (Takei, Niigata, Japan) in an upright position. The subjects held the dynamometer in the hand to be tested, with their arms straight and a 15-degree angle between arm and body, and squeezed the dynamometer with maximal isometric efforts for five seconds. The handle of the dynamometer was located between the second interphalangeal joint of the four fingers and the palm at the base of the thumb. After measuring the HGS twice, the highest value was recorded to the nearest 0.1 kg. HGS was measured for both hands and the higher value was selected for analysis.
The sit-up test measures abdominal muscle endurance. The starting position was lying on one’s head and back with knees bent at 45° and a fist-width gap between the knees. Then, the subjects raised their upper body forward with their fingers crossed behind their head until their elbows touched their thighs, and then lowered the trunk until their shoulder blades touched the mat. A measurer held the lower legs during the test and the number of completions for one minute were recorded.
The step test was used to estimate aerobic capacity with a step box and a metronome-based step frequency. Subjects were instructed to step up and down on a step box (with a height of 30 cm for men and 20 cm for women) at a rate of metronome beat (30 steps per minute for men and 24 steps per minute for women) for 3 minutes. After the stepping activity was completed, they immediately sat down, and their pulse rate during the recovery phase was recorded through the wrist pulse beat receiver. Maximal oxygen capacity (VO2max, mL O2/kg/min) was estimated by the following equations: VO2max_step =70.597 – (0.246×age) + (0.077×h) – (0.222×bm) – (0.147×PR60s) for men and 54.33 – (0.185×age) + (0.097×h) – (0.246×bm) – (0.122×PR60s) for women, where h is height in cm, bm is body mass in kg, and PR60s is pulse rate at 60 s of recovery phase in bpm [8]. In some centers, the aerobic fitness of a small number of participants (n =377) was measured through a 6-minute walk test. However, as the 6-minute walk test data did not supply enough data to calculate VO2max from the given equation formula, we could not compare the result of estimated VO2max from the step test. In addition, the 6-minute walk test was not performed for individuals with HI. Therefore, the results of the test were not included in the study.
Sit-and-reach test was used to assess flexibility. The subjects sat on a mat with their knees fully extended and the soles of their feet touching the vertical board of a flexion meter (BS-FF, Biospace, Seoul, Korea). They then bent their trunk to reach forward with their palms pushing out the ruler of the device as far as possible without bending their knees. After measuring twice, the highest value was recorded to the nearest 0.1 cm.
These fitness tests were measured in the order of muscular strength and endurance, flexibility, and aerobic fitness.
Standing height was measured to the nearest 0.1 cm with a stadiometer and a bioelectrical impedance analysis (Biospace, Seoul, Korea) was used to measure body mass to the nearest 0.1 kg and percentage (%) fat. Body mass index (BMI) was calculated as body mass (in kilograms) divided by the square of height (in meters).

3. Measurement of blood pressure

Systolic and diastolic blood pressures were measured using an automatic sphygmomanometer (Biospace, Seoul, Korea) after more than 5 minutes of stable state and 30 minutes from any consumption of nicotine, alcohol, and coffee. Trained personnel assisted the subjects’ blood pressure measurement to support their arms at heart level and to sit on a chair with back and feet support with their legs uncrossed, without any movement and conversation.

4. Type and severity of disability

Type and severity of disability were recorded based on the official Disability Identification Card of the participants. In case of dual impairment, the impairment with higher severity was recorded. The severity of disability was graded from Grades 1–6 by a specialist physician using the Korean Disability Classification System of the Ministry of Health and Welfare [9], which has been in transition to a new classification system: severe (Grades 1–3) and mild (Grades 4–6), since 2019 [10]. Severity of disability in the dataset indicated the official grades of the participants provided using these criteria. For ID, Grade 1 was evaluated based on the following criteria: intelligence quotient (IQ) of 35 or less, significant difficulty in adapting to daily and social life, requiring the support/supervision of others during the lifetime; Grade 2 was evaluated as: IQ ≥ 35 and < 50, trainability for simple behaviors of daily functioning, and ability to hold jobs that are not complicated, requires no special skills, and can be performed with some supervision and help; Grade 3 was evaluated as: IQ ≥ 50 and ≤ 70, capability of social and vocational rehabilitation through education. For VI, Grades 1 and 2 were provided for those whose visual acuity of the better eye was ≤ 0.02 and ≤ 0.04, respectively, by the decimal system; Grade 3 for those whose visual acuity of the better eye was ≤ 0.06 or whose visual field remained ≤ 5 degrees. For HI, Grade 2 and Grade 3 were provided to individuals with ≥ 90 dB and ≥80 dB hearing loss of both ears, respectively.

5. Statistical analysis

Average or proportion of variables was investigated using descriptive statistics. Subjects were considered to have high blood pressure (HBP) if systolic blood pressure (SBP) was ≥140 mmHg or diastolic blood pressure (DBP) was ≥ 90 mmHg, consistent with the definition from the Korean Society for Hypertension [11]. The BMI group status of the subjects was categorized as underweight, normal, overweight, and obese if it was <18.5, 18.5–22.9, 23.0–24.9, and ≥ 25.0 kg/m2 respectively according to the Asian Pacific classification of obesity [12]. Differences in physical fitness parameters according to the type of disability were determined by one-way analysis of variance (ANOVA). The proportion of HBP participants, BMI group status, and other physical fitness parameters according to the severity of the disability in each type of disability were analyzed by χ2 test or one-way ANOVA. The Scheffe or Games-Howell test was used for the post-hoc analysis. The odds ratio of HBP after adjustment for age, sex, severity of disability, and BMI group status was analyzed using multiple logistic regression analysis. Statistical Package for the Social Sciences (SPSS) version 27 (IBM Corp., Armonk, NY, USA) was used for analysis, and p-values < 0.05 were considered statistically significant.

RESULTS

1. Demographic characteristics of the subjects

The mean age of the participants was 34.1 years with 60.3% being men. There were 11,011 (93.3%) individuals with ID, 576 (4.9%) with VI, and 215 (1.8%) with HI. With regard to the severity of disability, 3,941 (33.4%), 4,928 (41.4%), and 2,933 (24.9%) were Grades 1, 2 and 3, respectively. The proportion of disabled adults having HBP was 20.4%. In terms of BMI group, 53.4% and 6.2% of the disabled adults were obese (BMI ≥ 25 kg/m2) and underweight (BMI <18.5 kg/m2) respectively (Table 1).

2. Physical fitness parameters and blood pressure according to disability type

There were significant differences in muscular strength and endurance (HGS and sit-up test), aerobic fitness (VO2max_step), flexibility (sitand-reach test), BMI, % fat, and SBP across types of disability. Post-hoc test shows that HGS, sit-up test, and sit-and-reach test were significantly lower in individuals with ID compared to those with VI and HI. Moreover, BMI was significantly higher in individuals with ID than those with VI, while SBP was significantly higher in individuals with VI than those with ID (Table 2). Detailed results of gender-segregated analysis was provided in Appendix 1.
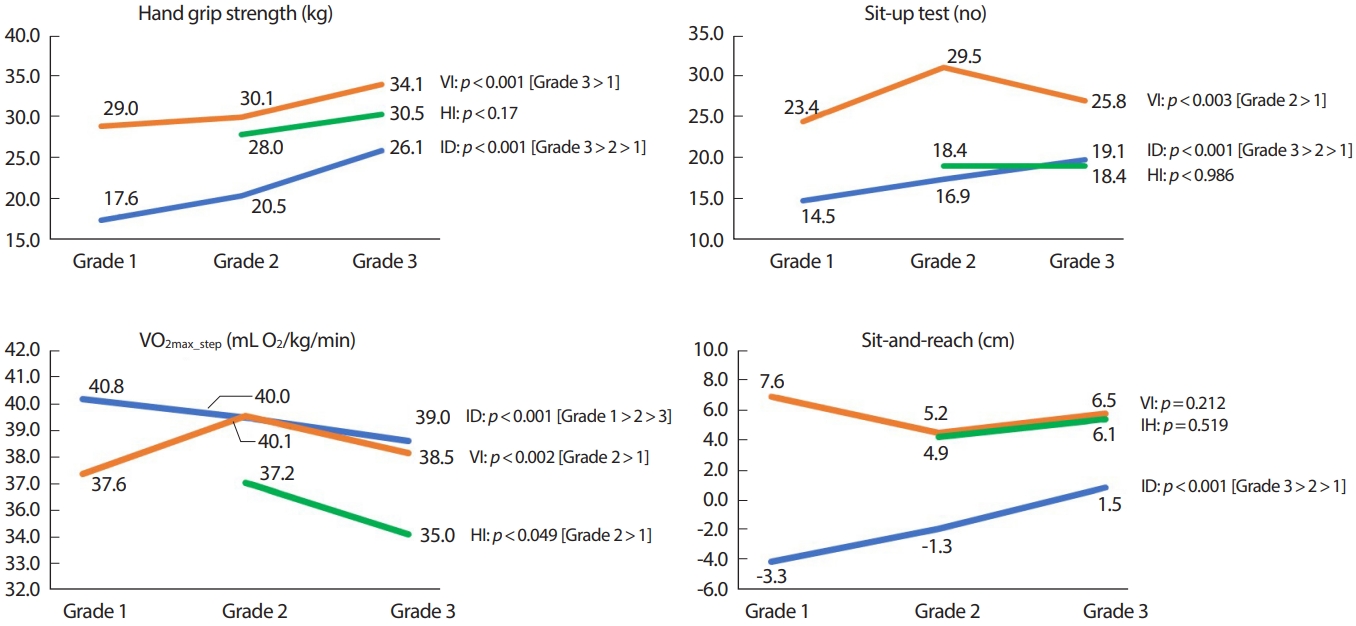
Fig. 2 shows significant differences in HRPF parameters according to the severity of disability in each group of ID, VI, and HI. For individuals with ID, muscular strength and endurance and flexibility (HGS, sit-up test, and sit-and-reach test) were the lowest in Grade 1, followed by Grades 2 and 3. Among individuals with VI, aerobic fitness and muscular strength and endurance were significantly lower in the most severely disabled group. The significant differences in muscular strength and endurance according to the severity in this group were shown only in men by gender-segregated analysis (refer to Appendix 2 for details). For individuals with HI, only aerobic fitness was significantly lower in the severe group. Detailed results of gender-segregated analysis was provided in Appendix 2.

3. Blood pressure and body mass index according to severity of disability in ID, VI and HI groups

Table 3 shows the differences in the proportion of HBP participants and BMI group status of underweight, normal, overweight, and obese groups according to the severity of disability in ID, VI, and HI, respectively. For individuals with ID, the proportion of HBP participants and BMI group status were significantly different according to the severity of disability. However, there was a significant difference in the proportion of HBP participants only for individuals with VI, while there was no difference in the blood pressure and BMI group status for individuals with HI, according to the severity of disability. Detailed results of gender-segregated analysis was provided in Appendix 3.

4. Factors associated with high blood pressure for each disability group

For individuals with ID, the odds ratio (95% confidence interval) of HBP was 1.211 (1.069–1.371) and 0.762 (0.675–0.861) in Grades 1 and 2 respectively, compared to Grade 3 after adjusting for age, sex, and BMI. The odds ratio of HBP was 2.314 (1.198-4.470) in Grade 1 VI compared to Grade 3 VI, and 3.698 (1.187-11.524) for Grade 2 HI compared to Grade 3 HI (Table 4).

DISCUSSION

In this study, we revealed the significant differences in HRPF parameters, HBP rates, and BMI group status based on the type and severity of disabilities among individuals with ID, VI, and HI. Furthermore, we identified a significant association between the severity of disabilities and the risk of HBP.
Lower levels of physical activity and fitness definitely lead to health risks [13,14]. People with ID, VI, and HI show lower levels of physical activity [15-20], although they require the same amount of physical activity as the non-disabled individuals. Possible barriers to physical activity in the case of disabled people include not only functional impairment itself but also social and personal factors such as isolation, inadequate support and opportunities, cognitive problems, lack of motivation, and low perception of health risk [16, 21-24]. Although it can be assumed that the type and severity of disability will affect the health of people with disabilities, few studies have compared health-related and metabolic parameters according to the type and severity of disability in large sample sizes.
The prevalence of obesity among people with disabilities in this study was 53.4%, much higher than the 38.5% of the non-disabled population [25] and exceeded 50% in all the grades of disability of HI and ID. This is higher than all values of 35–48% from previous studies on Korean adults with ID [5,7]. Prevalence gaps could occur due to differences in the age, type, and severity of disability among the participants of the studies; individuals with more severe disabilities of Grades 1–3 who were affected more by limitation of activities were included in the study. In this study, the prevalence of being underweight was 6.5% among all severely disabled patients. It was observed in 8.5% of people with Grade 1 disabilities, which was nearly twice the prevalence of 4.8% among the non-disabled population [26]. The close interrelationship between disability [6,24,27], malnutrition, and underweight status is another public health concern since long-term malnutrition is related to morbidity and mortality as well as associated issues relating to human rights [27,28].
The prevalence of hypertension among Korean adults with disabilities is 49.9% [2], much higher than the overall prevalence among Korean adults, which is 29.4% [29]. In this study, the proportion of HBP participants among Korean adults with disabilities was estimated to be 20.4%, based on one measurement of blood pressure on the day of the fitness test. Therefore, the HBP rate has a different meaning from the prevalence of hypertension, but it could reflect the control rate of blood pressure regardless of the pre-existing diagnosis of hypertension. The HBP rate differed according to the severity of disability in people with ID and VI but not in those with HI. The odds ratio of having HBP was significant according to the severity of disability for all types of disabilities. The cause of the lower odds ratio of Grade 2 compared to Grade 3 ID could not be concluded, which needs further investigation to explain the influential factors.
Low physical fitness due to inactivity, hypertension, and obesity are well-known risk factors for cardiovascular disease [30-32]. Therefore, the findings of our study, which elucidate higher prevalence of obesity and elevated blood pressure in people with severe disabilities compared to non-disabled individuals, impose the need for a targeted health care intervention strategy in these groups.
According to the type of disability, the HRPF parameters of people with ID were generally lower than those with VI and HI. Most of the HRPF parameters of persons with ID were the lowest in Grade 1, followed by Grades 2 and 3, and these significant differences in physical fitness according to severity of disability were prominent in ID. ID is characterized by significant cognitive, functional, and adaptive skills [33]. Two of the most important factors influencing low fitness levels among persons with ID are motor developmental delay and related lower capability of executing motor tasks to varying degrees [23,34,35]. Another important factor is low perception of health risk and benefit [24,36], thereby emphasizing the role of the public health in enhancing their physical activity.
Individuals with VI showed significant differences according to the severity of muscular strength, endurance, and aerobic fitness. This significance was observed between Grade 1 and the others by post-hoc analysis, which indicates that persons with Grade 1 VI are very vulnerable. Visual loss is associated with poor balance and falls, and subsequent fear of falling leads to restricted and fragmented daily activities [37,38]. They are predicted to have a significant decline in physical activity and fitness.
Although HI among older adults has been associated with decreased levels of physical activity in previous studies [15,16,39,40], the proportion of HBP participants, BMI group status, and physical fitness parameters were found to be less affected by the severity of impairment in this study. This might be due to the lower impact on daily living and higher participation in physical activities of people with HI compared to people with ID and VI [19], which should be proven by studies with larger sample sizes.
Some exercise interventions have reported positive changes in musculoskeletal strength, maximal oxygen uptake, and blood pressure in people with ID [41] and improvement of functional capacity and decrease in falls among people with VI [42,43]. This study reveals more pronounced lower fitness levels in people with severe disabilities, thereby warranting the need for social interest and support to develop evidence-based exercise guidelines for these groups.
This study had some limitations, especially given that it was a secondary analysis of an existing dataset. First, as the measurement was usually based in disability centers or facilities, the number of participants had a large discrepancy in terms of the types of disabilities. This can limit statistical interpretation and is insufficient for representing all people with disabilities. Second, the proportion of HBP participants was based on the results of a single measurement of blood pressure on the test day, without information regarding pre-existing hypertension or antihypertensive agents. In addition, there was no confirmation via manual measurement in case of HBP. Therefore, true prevalence of hypertension could be over- or under-estimated due to whitecoat effect or adequate hypertension control owing to anti-hypertensive medication use, respectively. Third, the data did not separate dual impairments such as individuals with VI and HI, which could influence the results. Fourth, the data had many missing values, possibly due to participants’ refusals and inconsistent inputs. Fitness tests for people with disabilities were complicated and required additional time and effort, despite the standard protocols. Especially, persons with ID were very heterogenous and requested time for gaining familiarity with the test procedures and needed further motivation strategies [21]. More experienced trainings for measurers can add to the accuracy of the data. Lastly, data on metabolic diseases other than hypertension as well as on behavioral factors such as food intake and physical activity levels could not be collected, which could largely influence participants’ health status. Further prospective studies are needed to evaluate HRPF parameters according to disability type and severity, including analysis of social, behavioral, and clinical factors. These limitations notwithstanding, this study investigated HRPF as well as the prevalence of HBP and BMI using large national data from people with severe disabilities in Korea, which would be helpful in promoting health in these vulnerable population.

CONCLUSION

In conclusion, HRPF parameters were generally lower in adults with ID than those with VI or HI. Several HRPF parameters, BMI group status, and HBP rates were significantly different according to the severity of disabilities, and higher odds ratios of HBP were estimated in more severe grades of disabilities. The differences across levels of severity were more prominent in individuals with ID. A tailored health promotion strategy is needed for this population to monitor risks and prevent diseases.

Conflict of Interest

The authors declare no conflict of interest.

AUTHOR CONTRIBUTIONS

Conceptualization: YH Kim, SH Kim, T Kim, R Ma; Data curation: SH Kim; Formal analysis: YH Kim, SH Kim; Funding acquisition: YH Kim, R Ma; Methodology: YH Kim, SH Kim, T Kim; Visualization: SH Kim; Writing - original draft: YH Kim, SH Kim; Writing - review & editing: YH Kim, SH Kim, T Kim, R Ma.

Fig. 1.
Fig. 1.
Flow diagram of the participants analyzed in this study. ID, intellectual disability; VI, visual impairment; HI, hearing impairment.
ksep-2023-00563f1.jpg
Fig. 2.
Fig. 2.
Physical fitness parameters according to severity of disability. In ID, Grades 1-3 follow a trend of decreasing muscular strength and flexibility; VI's most severe group has lower aerobic fitness and strength; HI's severe group only shows lower aerobic fitness. ID, intellectual disability; VI, visual impairment; HI, hearing impairment, p-values from one-way ANOVA for each type of disability (Scheffe or Games-Howell post-hoc test).
ksep-2023-00563f2.jpg
Table 1.
Characteristics of the subjects (N=11,802)
Total (N = 11,802) Male (N = 7,121) Female (N = 4,681)
Age (yr)* 34.1 ± 11.8 33.1 ± 11.4 35.7 ± 12.2
Height (cm)* 162.4 ± 11.0 167.8 ± 9.2 154.3 ± 8.4
Weight (kg)* 68.7 ± 17.2 73.1 ± 17.2 61.9 ± 14.6
BMI (kg/m2) 25.9 ± 5.3 25.9 ± 5.2 25.9 ± 5.4
Fat percentage* 32.3 ± 9.7 28.7 ± 8.6 37.8 ± 8.5
Type of disability* ID 11,011 (93.3%) 6,661 (93.5%) 4,350 (92.9%)
VI 576 (4.9%) 361 (5.1%) 213 (4.6%)
HI 215 (1.8%) 97 (1.4%) 118 (2.5%)
Severity of disability* Grade 1 3,942 (33.4%) 2,570 (36.1%) 1,372 (29.3%)
Grade 2 4,926 (41.7%) 2,814 (39.5%) 2,112 (45.1%)
Grade 3 2,934 (24.9%) 1,737 (24.4%) 1,197 (25.6%)
High blood pressure* Yes 2,403 (20.4%) 1,663 (23.4%) 740 (15.8%)
No 9,399 (79.6%) 5,458 (76.6%) 3,941 (84.2%)
BMI status Underweight 733 (6.2%) 435 (6.1%) 298 (6.4%)
Normal 2,878 (24.4%) 1,725 (24.2%) 1,154 (24.7%)
Overweight 1,890 (16.0%) 1,111 (15.6%) 779 (16.6%)
Obese 6,300 (53.4%) 3,850 (54.1%) 2,450 (52.3%)

Data are shown as mean±standard deviation or N (%).

BMI, body mass index; ID, intellectual disability; VI, visual impairment; HI, hearing impairment,

BMI status was categorized as underweight, normal, overweight, and obese for the values <18.5, 18.5–22.9, 23.0–24.9, and ≥25.0 kg/m2, respectively.

* p<0.01 by student t-test or χ2 test.

Table 2.
Physical fitness parameters and blood pressure according to disability type
Variables Disability type N Mean ± SD p-value* post-hoc
HGS (kg) ID 10,850 21.0 ± 9.7 < 0.001 VI, HI > ID
VI 570 30.0 ± 12.2
HI 212 28.5 ± 10.4
Sit-up test (no) ID 10,285 16.7 ± 10.1 < 0.001 VI, HI > ID
VI 534 24.7 ± 14.7
HI 187 18.3 ± 11.6
VO2max_step (mL O2/kg/min) ID 9,365 40.0 ± 6.2 < 0.001 ID> VI> HI
VI 500 38.1 ± 5.4
HI 175 36.7 ± 5.9
Sit-and-reach (cm) ID 10,539 -1.2 ± 12.7 < 0.001 VI, HI > ID
VI 571 7.1 ± 11.8
HI 207 5.1 ± 10.6
BMI (kg/m2) ID 11,008 25.9 ± 5.3 0.002 ID > VI
VI 576 25.2 ± 4.6
HI 214 25.8 ± 4.4
Fat percentage ID 10,772 32.5 ± 9.7 < 0.001 ID > HI, VI
VI 571 30.1 ± 9.7
HI 212 32.4 ± 9.6
SBP (mmHg) ID 10,964 123.4 ± 13.5 < 0.001 VI > ID
VI 576 126.4 ± 13.6
HI 215 124.7 ± 12.9
DBP (mmHg) ID 10,963 79.6 ± 10.8 0.214
VI 575 80.0 ± 9.1
HI 215 80.7 ± 10.6

BMI, body mass index; HGS, hand grip strength; VO2max_step, estimated maximal oxygen capacity from step test; SBP, systolic blood pressure; DBP, diastolic blood pressure; ID, intellectual disability; VI, visual impairment; HI, hearing impairment.

* p-value from one-way ANOVA,

Welch test (not equal variance, heteroscedasticity),

Scheffe or Games-Howell (not equal variance) post-hoc test.

Table 3.
Blood pressure and BMI status according to severity of disability in ID, VI and HI groups
Disability type Variables Status Grade 1 Grade 2 Grade 3 p-value
n (%) n (%) n (%)
ID groups High BP Yes 847 (23.9%) 766 (16.4%) 618 (22.1%) < 0.001
No 2,698 (76.1%) 3,906 (83.6%) 2,176 (77.9%)
BMI status Underweight 275 (7.8%) 279 (6.0%) 144 (5.2%) < 0.001
Normal 849 (23.9%) 1,167 (25.0%) 654 (23.4%)
Overweight 522 (14.7%) 764 (16.3%) 449 (16.1%)
Obese 1,899 (53.6%) 2,462 (52.7%) 1,547 (55.4%)
VI groups High BP Yes 108 (27.2%) 10 (12.3%) 12 (12.2%) < 0.001
No 289 (72.8%) 71 (87.7%) 86 (87.8%)
BMI status Underweight 14 (3.5 %) 7 (8.6%) 7 (7.1%) 0.306
Normal 106 (26.7%) 21 (25.9%) 30 (30.3%)
Overweight 81 (20.4%) 19 (23.5%) 20 (20.4%)
Obese 196 (49.4%) 34 (42.0%) 41 (41.8%)
HI groups High BP Yes - 38 (22.0%) 4 (9.5%) 0.068
No 135 (78.0%) 38 (90.5%)
BMI status Underweight - 5 (2.9%) 2 (4.8%) 0.897
Normal 41 (23.7%) 11 (26.2%)
Overweight 28 (16.2%) 7 (16.7%)
Obese 99 (57.2%) 22 (52.4%)

BMI, body mass index; BP, blood pressure; ID, intellectual disability; VI, visual impairment; HI, hearing impairment.

* Subjects were considered to have HBP if systolic blood pressure was ≥140 mmHg or diastolic blood pressure was ≥90 mmHg,

BMI status was categorized as underweight, normal, overweight, and obese if it was <18.5, 18.5–22.9, 23.0–24.9, and ≥25.0 kg/m2, respectively,

p-value from χ2 test.

Table 4.
Odds ratios of high blood pressure for each disability type
Odds ratio [95% confidence interval]
ID groups VI groups HI groups
Age 1.019 [1.015–1.024]** 1.035 [1.018–1.053]** 1.045 [1.015–1.076]**
Female sex 0.589 [0.531–0.652]** 0.566 [0.362–0.887]* 0.612 [0.297–1.261]
BMI 1.065 [1.056–1.075]** 1.071 [1.023–1.122]** 1.094 [1.003–1.193]*
Severity of disability
 Grade 1 1.211 [1.069–1.371]** 2.314 [1.198–4.470]* -
 Grade 2 0.762 [0.675–0.861]** 1.127 [0.450–2.818] 3.698 [1.187–11.524]*
 Grade 3 1.0 1.0 1.0

BMI, body mass index; ID, intellectual disability; VI, visual impairment; HI, hearing impairment.

Subjects were considered to have HBP if systolic blood pressure was ≥140 mmHg or diastolic blood pressure was ≥90 mmHg. BMI status was categorized as underweight, normal, overweight, and obese if it was <18.5, 18.5–22.9, 23.0–24.9, and ≥25.0 kg/m2, respectively.

* p<0.05,

** p<0.01 from multiple logistic regression analysis after adjusting for age, sex, and BMI.

REFERENCES

1. Centers for Disease Control and Prevention. Disability and health overview. 2020 Sep 16; Retrieved from https://www.cdc.gov/ncbddd/disabilityandhealth/disability.html.

2. Korea Disabled People’s Development Institute. Annual report on disability statistics 2022. Seoul: Korea Disabled People’s Development Institute 2022.

3. Corbin CB, Welk GJ, Corbin WR, Welk KA. Concepts of physical fitness: active lifestyles for wellness. 14th ed., New York: McGraw-Hill Higher Education 2008.

4. Korea Paralympic Committee. Physical fitness measurement method. 2018; Retrieved from https://nfa.koreanpc.kr/.

5. Bhaumik S, Watson JM, Thorp CF, Tyrer F, McGrother CW. Body mass index in adults with intellectual disability: distribution, associations and service implications: a population-based prevalence study. J Intellect Disabil Res. 2008;52(4):287-98.
crossref pmid
6. Jeong G, Chun B. Analysis of the relationship between obesity factors and health-related physical fitness factors among people with intellectual disabilities in South Korea. Int J Environ Res Public Health. 2021;18(12):6533.
crossref pmid pmc
7. Oh MK, Jang H, Kim YI, Jo B, Kim Y, et al. Differences in obesity rates between people with and without disabilities and the association of disability and obesity: a nationwide population study in South Korea. Journal of Preventive Medicine and Public Health. 2012;45(4):211.
crossref pmid pmc
8. Korea Sports Promotion Foundation. Physical fitness certification center model development report. Seoul: Ministry of Culture, Sports and Tourism 2014.

9. Korean disability classification criteria. 2018. (ordinance of the Ministry of Health and Welfare, editor. 151).

10. Korean disability classification criteria. 2019. (ordinance of the Ministry of Health and Welfare, editor. 117).

11. Kim HC, Ihm SH, Kim GH, Kim JH, Kim KI, et al. 2018 Korean society of hypertension guidelines for the management of hypertension: part I-epidemiology of hypertension. Clinic Hypertens. 2019;25(1):1-6.
crossref pmid pmc pdf
12. Pan WH, Yeh WT. How to define obesity? Evidence-based multiple action points for public awareness, screening, and treatment: an extension of Asian-pacific recommendations. Asia Pac J Clin Nutr. 2008;17(3):370.
pmid
13. Myers J, Kaykha A, George S, Abella J, Zaheer N, et al. Fitness versus physical activity patterns in predicting mortality in men. Am J Med. 2004;117(12):912-8.
crossref pmid
14. Williams PT. Physical fitness and activity as separate heart disease risk factors: a meta-analysis. Med Sci Sports Exerc. 2001;33(5):754.
crossref pmid pmc
15. Akınoğlu B, Kocahan T. Comparison of muscular strength and balance in athletes with visual impairment and hearing impairment. J Exerc Rehabil. 2018;14(5):765.
crossref pmid pmc pdf
16. Augestad LB, Jiang L. Physical activity, physical fitness, and body composition among children and young adults with visual impairments: a systematic review. Br J Vis Impair. 2015;33(3):167-82.
crossref pdf
17. Boslaugh SE, Andresen EM. Correlates of physical activity for adults with disability. Prev Chronic Dis. 2006;3(3):A78.
pmid pmc
18. Cho C, Shin W, Kong S. Participation in regular physical activity according to the type of disability, sex, point of disability diagnosis, and ability to walk independently in South Korea. In Multidisciplinary Digital Publishing Institute; 2021. p. 1079.

19. Gispen FE, Chen DS, Genther DJ, Lin FR. Association between hearing impairment and lower levels of physical activity in older adults. J Am Geriatr Soc. 2014;62(8):1427-33.
crossref pmid pmc pdf
20. Kuo PL, Di J, Ferrucci L, Lin FR. Analysis of hearing loss and physical activity among US adults aged 60-69 years. JAMA Netw Open. 2021;4(4):e215484.
crossref pmid pmc
21. Bossink LWM, van der Putten AA, Vlaskamp C. Understanding low levels of physical activity in people with intellectual disabilities: a systematic review to identify barriers and facilitators. Res Dev Disabil. 2017;68:95-110.
crossref pmid
22. Caton S, Chadwick D, Chapman M, Turnbull S, Mitchell D, et al. Healthy lifestyles for adults with intellectual disability: knowledge, barriers, and facilitators. J Intellect Dev Disabil. 2012;37(3):248-59.
crossref pmid
23. Karinharju K. Physical fitness and its testing in adults with intellectual disability. Dissertation, University of Jyväskylä; 2005.

24. Temple VA, Walkley JW. Perspectives of constraining and enabling factors for health-promoting physical activity by adults with intellectual disability. J Intellect Dev Disabil. 2007;32(1):28-38.
crossref pmid
25. Nam GE, Kim YH, Han K, Jung JH, Rhee EJ, et al. Obesity fact sheet in Korea, 2020: Prevalence of obesity by obesity class from 2009 to 2018. J Obes Metab Syndr. 2021;30(2):141-8.
crossref pmid pmc
26. Ministry of health and welfare of Korea, Korea centers for disease control and prevention. Korea Health Statistics 2019: Korea National Health and Nutrition Examination Survey (KNHANES VIII-1). Cheongju: 2020.

27. Mohamed SF, Leng SK, Vanoh D. Malnutrition and its risk factors among children and adolescents with intellectual disability (ID) in Asian countries: a scoping review. Malays J Nutr. 2021;27(1).
crossref
28. Bain LE, Awah PK, Geraldine N, Kindong NP, Siga Y, et al. Malnutrition in sub-saharan africa: burden, causes and prospects. Pan Afr Med J. 2013;15(1).
crossref pmid
29. Kim HC, Lee H, Lee HH, Lee G, Kim E, et al. Korea hypertension fact sheet 2022: analysis of nationwide population-based data with a special focus on hypertension in the elderly. Clin Hypertens. 20235;29(1):22.
crossref pmid pmc pdf
30. Hong S. Association of relative handgrip strength and metabolic syndrome in Korean older adults: Korea national health and nutrition examination survey VII-1. J Obes Metab Syndr. 2019;28(1):53.
crossref pmid pmc
31. Katzmarzyk PT, Church TS, Janssen I, Ross R, Blair SN. Metabolic syndrome, obesity, and mortality: impact of cardiorespiratory fitness. Diabetes Care. 2005;28(2):391-7.
pmid
32. LaMonte MJ, Barlow CE, Jurca R, Kampert JB, Church TS, et al. Cardiorespiratory fitness is inversely associated with the incidence of metabolic syndrome: a prospective study of men and women. Circulation. 2005;112(4):505-12.
crossref pmid
33. Boat TF and Wu JT. Mental disorders and disabilities among low-Income children. Washingtion (DC): The National Academles Press (US) 2015.

34. Jeoung B. Motor proficiency differences among students with intellectual disabilities, autism, and developmental disability. J Exerc Rehabil. 2018;14(2):275-81.
crossref pmid pmc pdf
35. Vuijk PJ, Hartman E, Scherder E, Visscher C. Motor performance of children with mild intellectual disability and borderline intellectual functioning. J Intellect Disabil Res. 2010;54(11):955-65.
crossref pmid
36. Mahy J, Shields N, Taylor NF, Dodd KJ. Identifying facilitators and barriers to physical activity for adults with down syndrome. J Intellect Disabil Res. 2010;54(9):795-805.
crossref pmid
37. Cai Y, Schrack JA, Wang H, E JY, Wanigatunga AA, et al. Visual impairment and objectively measured physical activity in middle-aged and older adults. J Gerontol A Biol Sci Med Sci. 2021;Nov. 15. 76(12):2194-203.
crossref pmid pmc pdf
38. van Landingham SW, Willis JR, Vitale S, Ramulu PY. Visual field loss and accelerometer-measured physical activity in the united states. Ophthalmology. 2012;119(12):2486-92.
crossref pmid
39. Li C, Haegele JA, Wu L. Comparing physical activity and sedentary behavior levels between deaf and hearing adolescents. Disabil Health J. 2019;12(3):514-8.
crossref pmid
40. Martinez-Amezcua P, Dooley EE, Reed NS, Powell D, Hornikel B, et al. Association of hearing impairment and 24-hour total movement activity in a representative sample of US adults. JAMA Netw Open. 2022;5(3):e222983.
crossref pmid pmc
41. Obrusnikova I, Firkin CJ, Farquhar WB. A systematic review and meta-analysis of the effects of aerobic exercise interventions on cardiorespiratory fitness in adults with intellectual disability. Disabil Health J. 2021;21:101185.
crossref pmid
42. Cheung KK. Effects of a structured exercise programme on functional balance in visually impaired elderly living in a residential setting. HK Physiother J. 2008;26(1):15-50.
crossref
43. Kovacs E, Toth K, Denes L, Valasek T, Hazafi K, et al. Effects of exercise programs on balance in older women with age-related visual problems: a pilot study. Arch Gerontol Geriatr. 2012;55(2):446-52.
crossref pmid

APPENDICES

Appendix 1.

Physical fitness parameters and blood pressure according to disability type, gender-segregated analysis

Variables Disability type Men
Women
N Mean ± SD p-value* post-hoc N Mean ± SD p-value* post-hoc
HGS (kg) ID 6,562 23.7 ± 10.1 < 0.001 VI> HI> ID 4,288 16.9 ± 6.8 < 0.001 VI > HI, ID
VI 358 33.6 ± 12.7 212 24.1 ± 8.4
HI 96 35.8 ± 9.8 116 22.4 ± 6.1
Sit-up test (no) ID 6,238 19.3 ± 10.1 < 0.001 VI, HI > ID 4,047 12.7 ± 8.5 < 0.001 VI, HI > ID
VI 345 26.1 ± 15.1 189 22.1 ± 13.7
HI 88 23.3 ± 11.1 99 14.0 ± 10.2
VO2max_step (mL O2/kg/min) ID 5,683 43.3 ± 4.9 < 0.001 ID > HI, VI 3,682 35.0 ± 4.4 < 0.001 ID, VI > HI
VI 316 40.2 ± 4.9 184 34.5 ± 4.1
HI 80 40.9 ± 4.9 95 33.2 ± 4.1
Sit-and-reach (cm) ID 6,331 -4.0 ± 12.4 < 0.001 VI, HI > ID 4,208 2.9 ± 11.9 < 0.001 VI> HI> ID
VI 362 4.1 ± 11.6 209 12.3 ± 10.3
HI 95 1.7 ± 11.8 112 8.0 ± 8.5
BMI (kg/m2) ID 6,659 25.9 ± 5.2 0.033 - 4349 25.9 ± 5.4 0.076
VI 363 25.3 ± 4.0 213 25.1 ± 5.5
HI 97 25.3 ± 3.8 117 26.3 ± 4.8
Fat percentage ID 6,515 28.9 ± 8.7 < 0.001 ID > VI, HI 4,257 37.9 ± 8.5 < 0.001 ID, HI > VI
VI 361 27.0 ± 7.9 210 34.9 ± 9.2
HI 96 25.9 ± 8.0 116 37.7 ± 7.4
SBP (mmHg) ID 6,628 125.2 ± 13.2 < 0.001 VI, HI > ID 4,336 120.7 ± 13.5 0.002 VI > ID
VI 363 127.8 ± 14.0 213 123.9 ± 12.3
HI 97 125.4 ± 13.3 118 122.3 ± 12.1
DBP (mmHg) ID 6,627 80.5 ± 10.8 0.063 4,336 78.2 ± 10.6 0.731
VI 362 80.7 ± 9.1 213 78.7 ± 8.9
HI 97 83.0 ± 9.9 118 78.8 ± 10.9

BMI, body mass index; HGS, hand grip strength; VO2max_step, estimated maximal oxygen capacity from step test; SBP, systolic blood pressure; DBP, diastolic blood pressure; ID, intellectual disability; VI, visual impairment; HI, hearing impairment.

* p-value from one-way ANOVA,

Scheffe or Games-Howell (not equal variance) post-hoc test.

Appendix 2.

Physical fitness parameters according to severity of disability, gender segregated analysis

Variables Disability type Severity Men
Women
N Mean ± SD p-value* N Mean ± SD p-value*
HGS (kg) ID Grade 1 2,242 19.4 ± 9.0 < 0.001 1,187 14.4 ± 6.5 < 0.001
Grade 2 2,668 23.4 ± 8.8 1,982 16.6 ± 6.4
Grade 3 1,652 30.2 ± 10.0 1,119 20.0 ± 6.6
VI Grade 1 252 31.9 ± 11.6 < 0.001 140 23.8 ± 7.4 0.775
Grade 2 51 33.6 ± 13.5 29 24.0 ± 7.0
Grade 3 55 41.3 ± 14.0 43 24.9 ± 11.8
HI Grade 2 78.0 35.2 ± 9.8 0.185 93 22.0 ± 6.1 0.131
Grade 3 18.0 38.6 ± 9.7 23 24.1 ± 6.0
Sit-up test (no) ID Grade 1 2,142 16.5 ± 9.7 < 0.001 1,118 10.7 ± 8.4 < 0.001
Grade 2 2,603 19.9 ± 9.5 1,924 13.0 ± 8.1
Grade 3 1,493 22.2 ± 10.7 1,005 14.5 ± 9.0
VI Grade 1 245 24.8 ± 14.7 0.027 124 20.7 ± 13.9 0.082
Grade 2 50 30.7 ± 17.3 25 27.2 ± 15.5
Grade 3 50 27.7 ± 13.7 40 23.4 ± 11.2
HI Grade 2 71 23.2 ± 11.0 0.909 81 14.1 ± 10.8 0.828
Grade 3 17 23.5 ± 11.9 18 13.6 ± 6.9
VO2max_step (mL O2/kg/min) ID Grade 1 1,954 43.6 ± 5.0 < 0.001 1,037 35.4 ± 4.4 < 0.001
Grade 2 2,392 43.6 ± 4.8 1,735 35.1 ± 4.4
Grade 3 1,337 42.1 ± 4.7 910 34.4 ± 4.5
VI Grade 1 228 39.7 ± 4.6 0.004 125 33.9 ± 4.2 0.009
Grade 2 48 42.2 ± 5.6 22 35.4 ± 2.8
Grade 3 40 40.7 ± 5.0 37 36.1 ± 4.1
HI Grade 2 63 41.2 ± 5.1 0.124 75 33.8 ± 3.9 0.013
Grade 3 17 39.5 ± 3.5 20 31.2 ± 4.5
Sit-and-reach (cm) ID Grade 1 2,179 -6.0 ± 12.7 < 0.001 1,183 1.5 ± 12.2 < 0.001
Grade 2 2,624 -4.1 ± 12.3 1,961 2.5 ± 11.8
Grade 3 1,528 -1.1 ± 11.6 1,064 5.1 ± 11.4
VI Grade 1 256 4.5 ± 11.5 0.283 137 13.4 ± 9.7 0.067
Grade 2 52 1.7 ± 12.9 29 11.4 ± 11.0
Grade 3 54 4.3 ± 10.7 43 9.3 ± 11.4
HI Grade 2 77 1.4 ± 12.4 0.641 91 7.8 ± 7.9 0.609
Grade 3 18 2.9 ± 9.2 21 8.9 ± 10.9
BMI (kg/m2) ID Grade 1 2,314 26.1 ± 5.6 0.020 1,231 25.8 ± 5.7 0.399
Grade 2 2,681 25.7 ± 5.1 1,988 26.0 ± 5.4
Grade 3 1,664 25.9 ± 4.7 1,130 26.0 ± 5.2
VI Grade 1 256 25.4 ± 4.0 0.397 141 25.7 ± 5.6 0.124
Grade 2 52 24.6 ± 4.2 29 24.2 ± 4.5
Grade 3 55 25.1 ± 3.9 43 23.9 ± 5.3
HI Grade 2 79 25.1 ± 3.5 0.503 94 26.0 ± 4.6 0.192
Grade 3 18 25.8 ± 5.0 23 27.4 ± 5.5

BMI, body mass index; HGS, hand grip strength; VO2max_step, estimated maximal oxygen capacity from step test; ID, intellectual disability; VI, visual impairment; HI, hearing impairment.

* p-value from one-way ANOVA.

Appendix 3.

Blood pressure and BMI status according to severity of disability in ID, VI, and HI groups, gender segregated analysis

Gender, Disability type Variables Status Grade 1 n (%) Grade 2n (%) Grade 3n (%) p-value
Men, ID groups High BP* Yes 602 (26.0%) 505 (18.8%) 440 (28.4%) < 0.001
No 1,712 (74.0%) 2,178 (81.2%) 1,224 (73.6%)
BMI status Underweight 168 (7.3%) 177 (6.6%) 72 (4.3%) < 0.001
Normal 544 (23.5%) 679 (25.3%) 382 (23.6%)
Overweight 313 (13.5%) 432 (16.1%) 266 (16.0%)
Obese 1,289 (35.6%) 1,395 (38.6%) 934 (25.8)
Women, ID groups High BP* Yes 245 (35.8%) 261 (38.2%) 178 (15.8%) < 0.001
No 986 (80.1%) 1,728 (86.9%) 952 (84.2%)
BMI status Underweight 107 (8.7%) 102 (5.1%) 72 (6.4%) 0.004
Normal 305 (24.8%) 488 (24.5%) 262 (23.2%)
Overweight 209 (17.0%) 332 (16.7%) 183 (16.2%)
Obese 610 (49.6%) 1,067 (536%) 613 (54.2%)
Men, VI groups High BP* Yes 80 (31.3%) 7 (13.5%) 8(14.5%)) 0.003
No 176 (68.8%) 45 (86.5%) 47 (85.5%)
BMI statu Underweight 9 (3.5%) 5 (9.6%) 1 (1.8%) 0.451
Normal 60 (23.4%) 12 (23.1%) 16 (29.1%)
Overweight 60 (23.4%) 11 (21.2%) 11 (20.0%)
Obese 127 (49.6%) 24 (46.2%) 27 (49.1%)
Women, VI groups High BP* Yes 28 (19.9%) 3 (10.3%) 4 (9.3%) 0.167
No 113 (80.1%) 26 (89.7%) 39 (90.7%)
BMI status Underweight 5 (3.5%) 2 (6.9%) 6(14.0%) 0.087
Normal 46 (32.6%) 9 (31.0%) 14 (32.6%)
Overweight 21 (14.9%) 8 (27.6%) 9 (20.9%)
Obese 69 (48.9%) 10 (34.5%) 14 (32.6%)
Men, HI groups High BP* Yes - 20 (25.3%) 1 (5.6%) 0.066
No - 59 (74.7%) 17 (94.4%)
BMI status Underweight - 2 (2.5%) 1 (5.6%) 0.718
Normal 17 (21.5%) 5 (27.8%)
Overweight 14 (17.7%) 4 (22.2%)
Obese 46 (58.2%) 8 (44.4%)
Women, HI groups High BP* Yes - 18 (19.1%) 3 (12.5%) 0.447
No - 76 (80.9%) 21 (87.5%)
BMI status Underweight - 3 (3.2%) 1 (4.2%) 0.986
Normal - 24 (25.5%) 6 (25.0%)
Overweight - 14 (14.9%) 3 (12.5%)
Obese - 53 (56.4%) 14 (58.3%)

BMI, body mass index; BP, blood pressure; ID, intellectual disability; VI, visual impairment; HI, hearing impairment.

* Subjects were considered to have HBP if systolic blood pressure was ≥140 mmHg or diastolic blood pressure was ≥90 mmHg,

BMI status was categorized as underweight, normal, overweight, and obese if it was <18.5, 18.5–22.9, 23.0–24.9, and ≥25.0 kg/m2, respectively,

p-value from χ2 test.

TOOLS
PDF Links  PDF Links
PubReader  PubReader
ePub Link  ePub Link
XML Download  XML Download
Full text via DOI  Full text via DOI
Download Citation  Download Citation
  Print
Share:      
METRICS
0
Crossref
0
Scopus 
1,315
View
21
Download
Related article
Editorial Office
The Korean Society of Exercise Physiology
Dept. of Healthcare and Science, Dong-A University, 37, Nakdong-daero 550beon-gil, Saha-gu, Busan 49315, Korea
TEL: +82-51-200-7517   E-mail: editor@ksep-es.org
Editorial Assistant: Taewan Kim +82-10-4019-0208
About |  Browse Articles |  Current Issue |  For Authors and Reviewers
Copyright © The Korean Society of Exercise Physiology.                 Developed in M2PI