Analysis of Time Loss Injury in Korean Professional Baseball Players
Article information

Abstract
PURPOSE
This prospective cohort study aimed to investigate the epidemiology of time-loss (TL) injuries in 68 Korean Baseball Organization (KBO) players aged 26.6±5.4 years (31 pitchers and 37 field players).
METHODS
Injury data collected during the 2021-2022 KBO league seasons were used to calculate the injury rate (IR), IR ratio (IRR), and TL. IR was calculated as follows: (total number of injuries×100)÷(total number of game exposures). IRR was computed as follows: (IR of pitchers)÷(IR of fielders). TL was defined as an injury that resulted in the inability to compete or participate in standard routines.
RESULTS
A total of 92 TL injuries were recorded from 5,320 athlete-exposures (1.7 per 100 athlete-exposures). Pitchers exhibited a 1.7-fold increase in IR (IRR =1.69, 95% CI=1.05-2.61, p=.018) and a 2.6-fold increase in the rate of severe injuries that resulted in a TL of ≥3 weeks (IRR=2.59, 95% CI=0.93-7.10, p=.045) compared to field players. The trunk/spine (20.6%) among pitchers and thigh/groin (22.4%) among field players were the most frequently injured body parts. Overuse (38.2%) and batted ball contact (38.2%) were the leading causes of injury among pitchers, whereas noncontact (36.2%) and overuse (17.2%) were the leading causes of injury among field players. Pitchers were most likely to be injured while pitching (55.9%) and fielding (38.2%), whereas field players were most likely to be injured while batting (31.0%) and base running (31.0%).
CONCLUSIONS
The current findings indicate that the characteristics of the injuries of KBO players differ by position, emphasizing the importance of a position-specific injury prevention program.
INTRODUCTION
Professional baseball was introduced as the first official professional sport in South Korea in 1982, and it has since grown in popularity to become the most attended sport in the country. According to the Korean Baseball Organization (KBO) statistics, 1.4 million people watched the inaugural season alone (https://www.koreabaseball.com/Record/Main.aspx). Prior to the imposition of COVID-19 restrictions in 2018, the figure had risen to an incredible 8 million [1]. The number of teams in the KBO league has grown as well. The league began with eight teams and has since expanded to ten [2]. Along with this expansion, the KBO league has begun recording official game videos and related data and distributing them via the internet.
Despite significant advancements over the last 40 years, the KBO league lacks a comprehensive injury surveillance system. In contrast, Major League Baseball (MLB) and the National Collegiate Athletic Association (NCAA) systematically report sports injuries and illnesses using resources such as the Disabled List (DL), the Health and Injury Tracking System (HITS), and the Injury Surveillance Program (ISP) [3-5]. The HITS and ISP contain detailed information on the date of injury, the body part injured, the mechanism and type of injury, the activity that resulted in the injury, and the duration of time loss (TL) due to injury. Such information should be painstakingly analyzed to provide critical scientific evidence for developing injury prevention strategies and training programs.
Several studies examining DL and ISP data have consistently shown that baseball-related injuries primarily affect the upper extremities, occur primarily during competitive games rather than practice, and are frequently caused by noncontact or overuse mechanisms [6-10]. Pitchers had a significantly higher rate of shoulder and elbow injuries [11], whereas fielders had a higher rate of lower extremity injuries [12]. A previous study involving MLB players found that infielders suffered hamstring injuries while base running, resulting in an average of 14.5 days off the field [13]. Despite the fact that baseball is considered a relatively safe sport [14], injuries do occur, including severe injuries that limit participation for at least 10 days and account for roughly a quarter of all injuries [8,10].
Sports injury data collection and analysis are considered critical work for understanding injury patterns in specific sports and leagues. Howev-er, as far as we know, few studies have reported injuries that limit KBO participation in the future. Furthermore, because game rules differ between leagues and playersʼ physical conditions vary, extrapolating injury patterns in KBO players based on MLB and NCAA injury epidemiology may be inaccurate. As a result, the aim of this study was to identify injury patterns among KBO players by analyzing TL injuries and game-related data from official games, with a particular emphasis on playing positions.
METHODS
1. Study design
The KBO regular season typically begins in April and ends in September, with each team playing 144 games during the regular season. In 2022, the KBO had 606 active players on 10 teams, with 250 on the first team roster and participating in official matches [2]. The data used in the current study were collected prospectively from 68 KBO players (31 pitchers and 37 field players) who appeared in at least one game during the 2021-2022 seasons which were extended to October due to the impact of CO-VID-19. The players had an average age of 26.6±5.4 years, a height of 181.7±5.8 cm, and a weight of 85.3±10.1 kg. Prior to study participation, all participants were given detailed information about the study and given their informed consent. The Institutional Review Board reviewed and ap-proved the study protocol (IRB No. SKKU 2020-06-012-003).
2. Data acquisition
A team athletic trainer (AT) used a predesigned spreadsheet to record all injury data immediately following each game. Injury data were collected according to the NCAA baseball injury epidemiology [6], and they included the date of injury, body parts injured, mechanisms and types of injury, activities at the time of injury, playing positions, and specific diagnoses. Non-baseball-related illnesses and injuries were excluded from the study. The researcher thoroughly reviewed all game videos and relevant records stored online to reduce the possibility of omitting any injury or game-related data.
3. Data analysis
A reportable injury was defined as one that occurred during participation in official games, required the attention of ATs or physicians, and resulted in at least one or more days of restricted participation in practice or competition [9,15,16]. An athlete-exposure (AE) was defined as 1 athlete appearing in 1 game. Injury rate (IR) was calculated using the following formula: [(total number of injuries×100)÷(total number of game exposures)]. The injury rate ratio (IRR) was computed using the following formula: [(IR of pitchers)÷(IR of fielders)], and it was compared between pitchers and field players. TL is defined as an injury that results in the inability to compete or practice as usual, and it is a criterion used to describe the severity of sports injuries [16]. Severe injuries were defined as those with a TL of ≥3 weeks, and they were meticulously documented, including the specific diagnosis and severity of the injury. In cases where a single injury resulted in multiple injuries to different parts and structures, only the most significant injury was recorded. Reinjuries that occurred after a return to play (RTP) were classified as reinjury mechanisms, as previously defined [9]. The criteria for RTP were established with the minimum re-quirement of being able to participate in practice games, the majority of which were second-tier matches. Days missed (DM) from competition represent the number of days from the date of injury to RTP.
4. Statistics
Continuous and categorical variables were described as mean (median) and frequency (percentage), respectively. Infielders, outfielders, and catchers were grouped together as field players. A linear regression mod-el was used to test for any significant differences in the IRs as the seasons progressed. An independent t-test was used to compare any significant difference in DM between pitchers and field players. An incidence rate ratio calculator was used to calculate IRRs and 95% confidence intervals (CIs). The level of statistical significance was set at p =.05. All statistical analyses were performed with IBM SPSS ver. 25.0 (IBM Corp., Armonk, NY, USA) and STATA ver. 18 (StataCorp, College Station, TX, USA).
RESULTS
Fig. 1 depicts IR trends by month: IR tended to peak in May and gradually decline, reaching its lowest point in October, with no significant difference in the IR across the months. As shown in Table 1, a total of 92 TL injuries were reported in 5,302 AEs during the sample period, resulting in an overall IR of 1.7 per 100 AEs, with 1,366 AEs among pitchers and 3,936 AEs among fielders. Pitchers had 2.5 IR per 100 AEs, while fielders had 1.5 IR per 100 AEs: pitchers had a 1.7 times higher IRR than fielders (IRR=1.69, 95% CI=1.05-2.61, p =.018). Particularly, pitchers had a 2.6 times higher IRR of severe injuries resulting in a TL of ≥3 weeks than field players (IRR=2.59, 95% CI=0.93-7.10, p =.045). Regardless of position, the mean (median) number of DM per injury was 12 (3) days among the KBO players included in the study, with 18 (6) days among pitchers and 8 (3) days among fielders (p =.021).
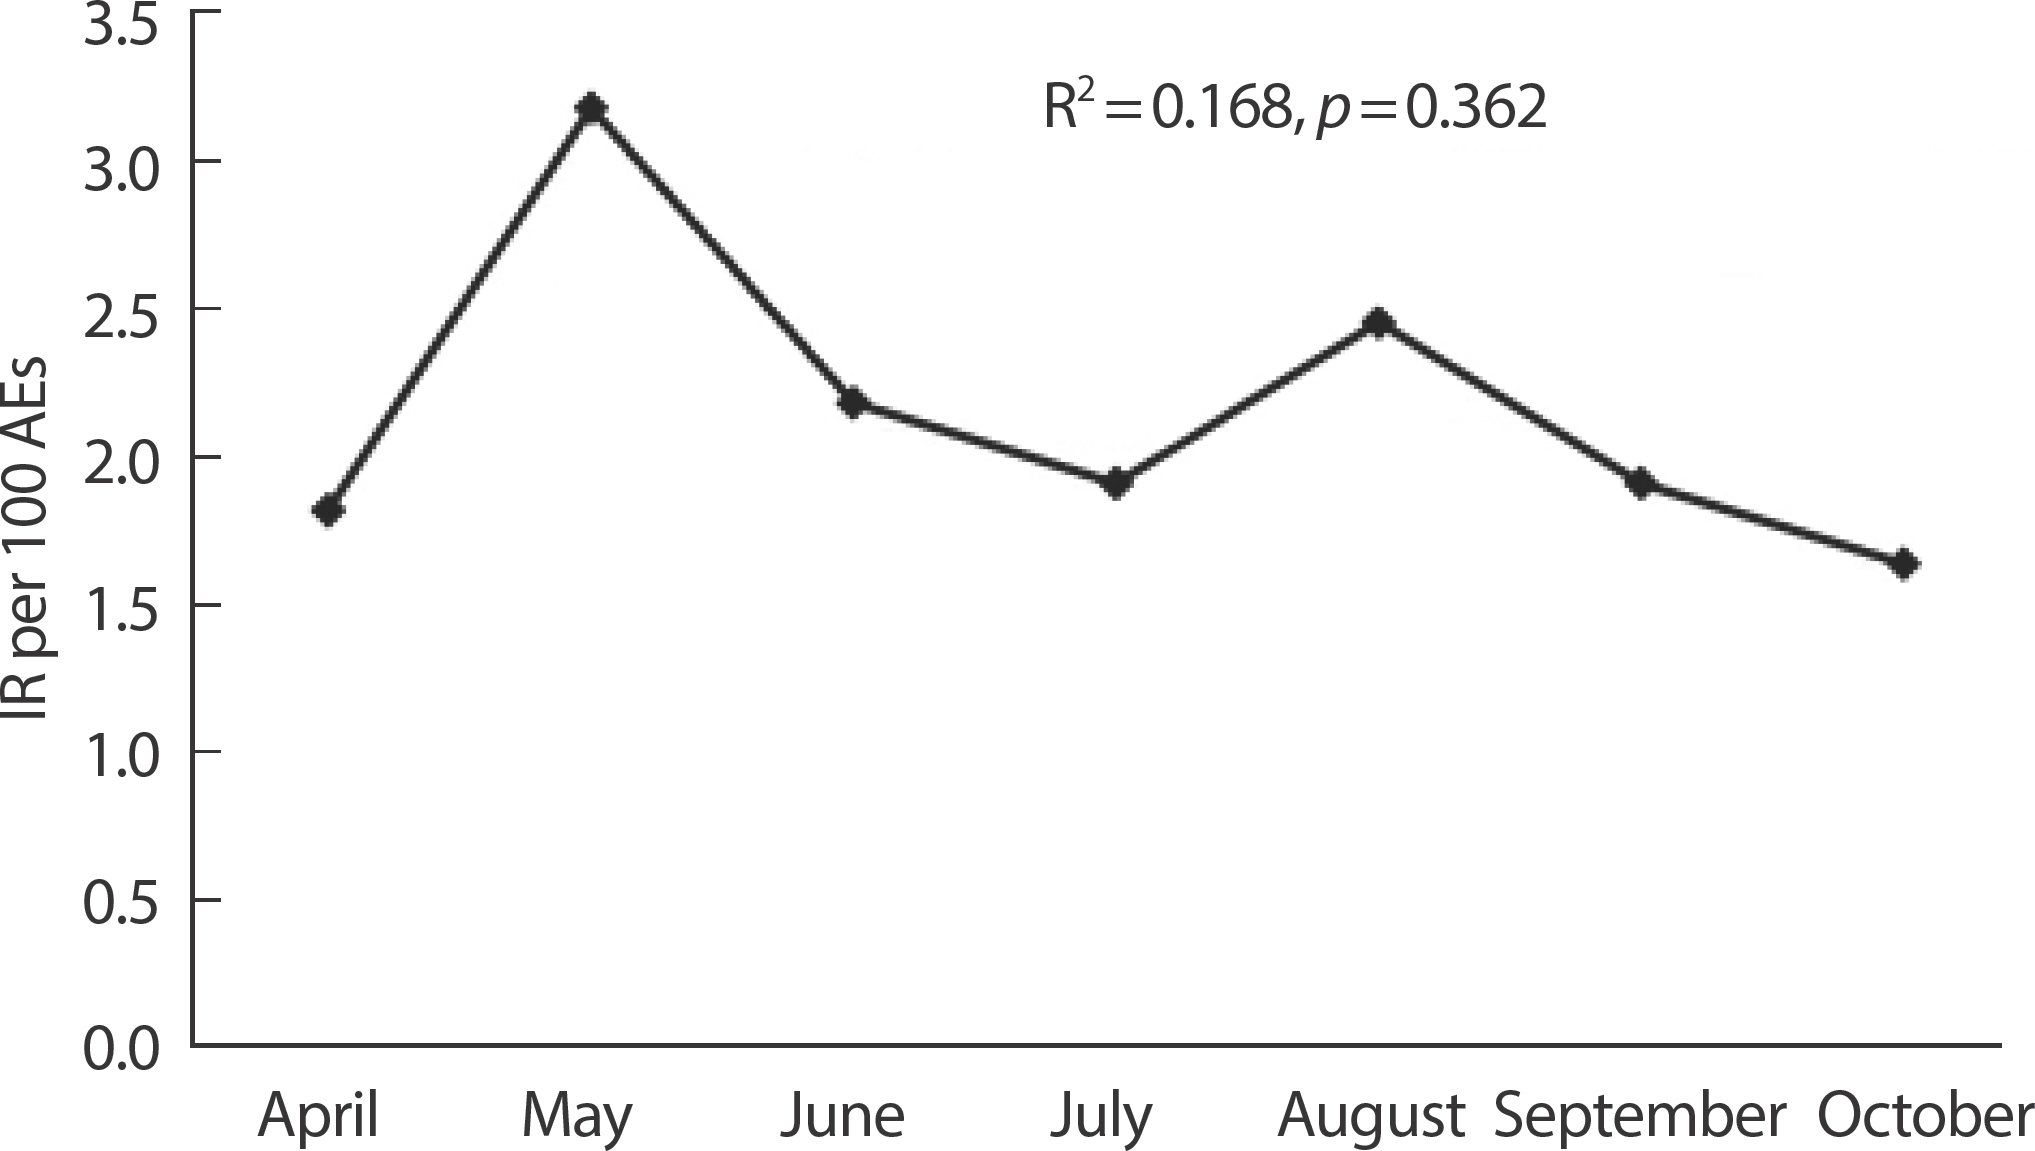
Injury trend across the months. IR: injury rate; AEs: athlete exposures.

Comparison of injury rate (IR) and days missed (DM) per injury between pitchers
Table 2 shows injured body parts as well as injury mechanisms and types. The overall injury proportion was 46.7% for the lower extremities and 30.4% for the upper extremities. The trunk/spine accounted for 19.5% of the overall injuries, followed by the thigh/groin (18.5%) and hand/wrist (17.4%). Trunk/spine (20.6%), lower leg (17.6%), hand/wrist (14.7%), and thigh/groin (11.8%) were the most frequently injured body parts (17.6%) among pitchers, accounting for 64.7% of all injuries. Hand/wrist (22.4%), trunk/spine (19.0%), and thigh/groin (19.0%) were the most frequently injured body parts (22.4%) among field players, accounting for 60.4% of all injuries. Noncontact accounted for 29.3% of the overall injury mechanism, followed by overuse (25.0%) and contact with batted balls (20.7%). Batted balls (38.2%) and overuse (38.2%) were the leading causes of injuries among pitchers, while noncontact (36.2%) and overuse (17.2%) were the leading causes of injuries among field players. Contusions accounted for 27.2% of all injury types, followed by spasms (23.9%), sprains (19.6%), and strains (12.0%). Contusions (32.4%) and spasms (17.6%) were the most common types of injuries among pitchers, while spasms (27.6%) and sprains (25.9%) or contusions (24.1%) were the most common types of injuries among field players.
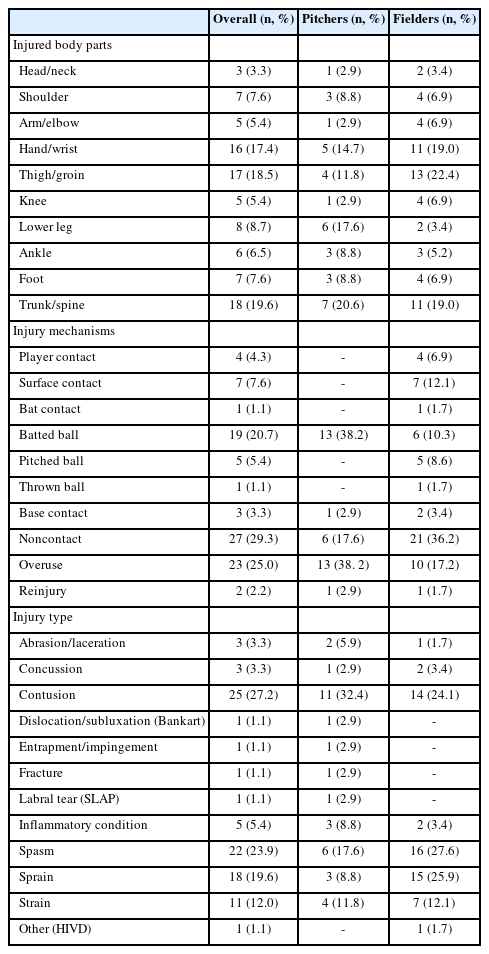
Injured body parts and mechanisms and types of injury
Table 3 summarizes the severe injuries with a TL of ≥3 weeks. The most common severe injuries suffered by pitchers were finger fractures, superior labrum anterior to posterior (SLAP) tears, Bankart lesions, and rotator cuff tears while pitching and/or fielding. Among them, the Bankart lesion was the only injury that ended the season. The most common severe injuries suffered by field players were muscle strains while running and batting, as well as ligament sprains while sliding and diving.
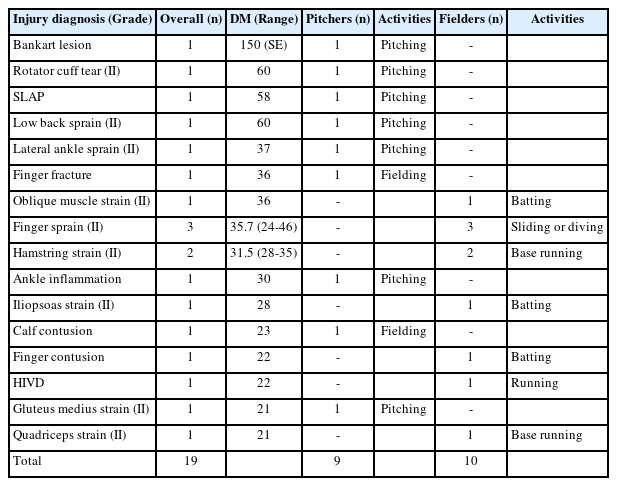
Severe injuries that resulted in a TL of ≥3 weeks
Table 4 lists the specific activities that resulted in injuries. The majority (81%) of all injury-caused activities were accounted for by fielding (20.7%), pitching (20.7%), base running (19.6%), and batting (19.6%): pitching (55.9%) and fielding (38.2%) were the specific activities among pitchers, while batting (31.0%), and base running (31.0%) were the specific activities among field players.
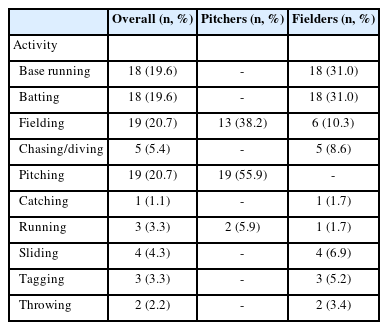
Activities at the time of injury
DISCUSSION
This study explored TL injuries sustained by KBO players during official games in the 2021 and 2022 seasons. In this study, we found that most injuries occurred in the first half of the season and gradually decreased as the season progressed. Pitchers had a higher IR and a higher DM than field players. Pitchers are more likely to sustain trunk/spine injuries, followed by lower leg, and hand/wrist injuries, whereas fielders are more likely to sustain thigh/groin, trunk/spine, and hand/wrist injuries. Finally, the severe injuries that result in a TL of ≥3 weeks included finger fractures, SLAP tears, Bankart lesions, and rotator cuff tears among pitchers, while they were muscle strains and ligament sprains among field players.
The IR trend observed during the current study season was consistent with previous findings of studies using HITS data to analyze injuries in MLB and Minor League Baseball (MiLB) [7,9,13,17] and DL data to report upper and lower limb injuries for MLB players [11,12]. An average IR of 1.7 per 100 AEs observed in the current study, with pitchers having a higher IR than fielders, is higher than those of previous studies [7,9,18]. By analyzing 7 years of MLB DL data from 2002 to 2008, for example, Posner et al. [7] reported an IR of 0.4 per 100 AEs in MLB players. By analyzing ten years of NCAA ISP data (2005-2014), Wasserman et al. [8] reported an IR of 0.5 per 100 AEs in collegiate men's baseball players. Although there are no clear explanations for the IR disparity between the current and previous studies, we speculate that differences in injury definition and reporting, different levels of competition, and different sample sizes could all be factors.
Additionally, we showed that injuries with a TL of ≥3 weeks accounted for 20.7% of all injuries in this sample of KBO players. In agreement with the current findings, Dick et al. [10] showed that game-related injuries resulting in a TL of ≥10 days accounted for 25.5% of all injuries by analyzing ISP data from 1998 to 2004. By analyzing ISP data from 2004 to 2014, Wasserman et al. [8] also reported that game-related injuries resulting in a TL of ≥3 weeks accounted for 25.3% of all injuries. The mean (median) DM of 12 (3) days observed in the current study tended to be lower than those of previous studies reporting mean (median) DM of 16 (6) days for all injuries in MLB and MiLB. [9] But pitchers had a significantly higher DM than fielders, and they also had a higher IR of severe injuries lasting ≥3 weeks, implying that the former sustained more severe injuries than the latter.
The trunk and spine and the thigh/groin were the most frequently injured body parts, accounting for approximately 38.1% of all injuries in this study. The current findings are supported in part by the Fact Sheets of Camp et al. [9] who analyzed HITS data and found that back/verte-bral injuries accounted for six of the top fifty injuries. Baseball players are particularly susceptible to trunk/spine injuries because the trunk and core connect the upper and lower body during baseball-related maneu-vers such as pitching, batting, and throwing [19]. Additionally, the current findings of the study also suggest that the injured body parts could be position-specific: the trunk and spine among pitchers and the thigh and groin among field players. By contrast, previous research on injuries in MLB and NCAA men's baseball players showed that trunk/spine injuries accounted for a relatively small proportion of all game-related injuries [6-8]. Boltz et al. [6] showed that trunk injury accounted for 7.8% of all game-related injuries in NCAA men's baseball players. Posner et al. [7] showed that spine and core injuries accounted for 11.7% of game-re-lated injuries in MLB players. A well-designed prospective study will be required to provide a clear answer about the disparity in the most frequently injured body parts among professional baseball players.
With respect to injury mechanisms, epidemiological studies have consistently reported that noncontact and overuse are the primary causes of TL injuries, with contact with balls or the playing surface being a common subsequent factor [6,8,9]. In line with previous findings, the current study also showed that noncontact was the most common cause of injury (29.3%), followed by overuse (25.0%) and contact with batted balls (20.7%), with pitchers being injured primarily by batted balls and fielders primarily by surface contact. Pitchers were more likely to sustain severe shoulder injuries such as Bankart lesions, SLAP tears, and rotator cuff tears, whereas fielders were more likely to sustain serious upper extremity injuries such as finger sprains and contusions. These findings are partially consistent with the findings of Fares et al. [11] who found that pitchers were more likely to sustain shoulder and elbow injuries, while fielders were more likely to sustain finger injuries. Taken together, the current findings show that KBO players have similar injury mechanisms to those sustained by MLB players.
This study acknowledges several limitations. First, we only looked at injuries that occurred during official games over two seasons (2021 and 2022) for 68 KBO players. As a result of the non-representative sample and the short study period, this study was unable to provide a comprehensive understanding of injury epidemiology across the entire KBO. Second, due to an insufficient number of injuries per position, infielders, outfielders, and catchers were grouped as fielders, preventing us from conducting individual positional analyses. Finally, off-season training, which was not monitored in this study, could have influenced regular-season overuse injuries. On the other hand, we believe that, despite the lack of an injury surveillance system, this study is both practically and clinically significant because it identified the overall injury patterns of KBO players by position while also analyzing TL injuries prospectively.
CONCLUSIONS
The current study examined TL injuries sustained by KBO players during the official KBO games in 2021 and 2022 and showed that pitchers are more vulnerable to severe injuries with a TL of ≥3 weeks compared to fielders. Additionally, pitchers and fielders had different injury epidemiology in terms of injured body parts as well as mechanisms and types of injury, implying the importance of a position-specific injury prevention program. A comprehensive, long-term epidemiological study involving a larger sample size is urgently needed to improve our understanding of injuries as well as early intervention in injury prevention for KBO baseball players.
ACKNOWLEDGMENTS
We thank all the Korea Baseball Organization (KBO) players who took part in this study.
Notes
All authors have no conflict of interest to disclose.
AUTHOR CONTRIBUTIONS
Conceptualization: MK Song; Data curation: MK Song; Formal analysis: MK Song, HS Kang; Funding acquisition: MK Song; Methodology: MK Song, HS Kang; Project administration: MK Song, HS Kang; Visualization: MS Song; Writing - original draft: MK Song; Writing - review & editing: HS Kang.