Influence of Maximal Strength on Bench Press and Trunk Rotation in Adapted Shot-put: A Pilot Investigation
Article information

Abstract
PURPOSE
Shot-put is a complex ballistic movement that involves segments’ translational and rotational motions. Its goal is to release the shot at maximum forward velocity (strength) at an angle of approximately 40º (rotation). Considering the adapted shot-put, those two components could be more limited in action. Therefore, the present study aimed to examine the correlations among the one-repe-tition maximum (1RM) test in the bench press (BP1RM) and trunk rotation (TR1RM) and the throwing distance of the adapted shot-put and body composition (Fat mass and Fat-free mass [FFM]), and the throwing distance of the adapted shot-put (TD) and 1RM results.
METHODS
Eighteen non-professional athletes were evaluated, and their anthropometric data were obtained (bio-impedance measurements). Afterward, the participants performed the BP1RM and TR1RM exercises. Finally, they performed the adapted shot-put in similar conditions as the official competitions, where three trials of ASP were performed, and the best of these trials were assessed.
RESULTS
The results showed a significant relationship between the throwing distance and 1RM results for both exercises (BP1RM (p=.040) and TR1RM (p=.002)) and with the amount of FFM (p=.045). Concerning FFM relationships, the results showed a positive relationship with both 1RM exercises (BP1RM (p=.034) and TR1RM (p=.003)). The Fat Mass results demonstrated an inverse correlation only with BP1RM (p=.035).
CONCLUSIONS
The results suggest that physical preparation, including BP1RM and TR1RM exercises, are fundamental to improving adapted shot-put performance. This showed preliminary indicators of which variables may influence the adapted shot-put that might help coaches and athletes to improve their performance. Nevertheless, those results should be carefully considered since the movement evaluated was very complex, especially when performed by participants unfamiliar with them, and because the same analysis included both sexes.
INTRODUCTION
Shot-put has been a permanent fixture within the Olympic program since its establishment in 1896. The shot-put is considered a complex multiarticular movement, that involves the majority of the body's musculature [1]. For a correct execution, the individual should pay attention to the torso rotation and simultaneously keep the rear knee bent [2]. Therefore, the mechanical flow of energy throughout the kinematic chain is a central concern to release the shot at maximum forward velocity [2-4]. In fact, the literature on athletes without disabilities indicated that release factors (i.e., velocity, height, and angle) are interdependent [5]. Moreover, the release velocity and angle are significant contributors to performance in the shot-put [6-8]. Thus, since around 90% of the shot-put throwing velocity is developed during the delivery phase [9], special attention has been made to muscular activation, being noticed that the pectoralis major and the quadriceps vastus lateralis were the muscles that are closely related to shot-put performance [10].
Alongside the Olympic shot-put, adaptations in Paralympic competitions have been applied to athletes with disabilities. In the shot-put com-petition, disabled athletes perform in a seated position, which leads to a greater lack of movements (or marginal movements) when compared with the whole-body movement. For that reason, paralympic athletes must modify their throwing techniques since the movement sequence is affected by their disability level [11]. The sequence of muscle action does not come from the lower extremities, through the torso, ending with contribution from the chest, arm, wrist, and hand as in the standing position [6,12]. Indeed, lower angles of release have been found in wheelchair putters, probably related to the forward lean trunk position adopted [12].
The shot-put is a highly technical movement and is a power-based event that requires a combination of strength, velocity, and explosiveness [12]. More specifically, to increase the shot-put throwing distance (TD) performance, individuals should pay attention to trunk rotational angle, trunk rotational velocity [13], and the maximum muscle strength of the athlete [11]. In fact, it was shown that the release velocity and angle are the most important predictors of throwing performance also in the seated shot-put, with release velocity being established as the best predictor [11]. However, in addition to the scarce literature, not all studies highlight the same components. For instance, in a study with male seated shot-putters [11], it was registered a significant positive correlation only between the release velocity and the distance thrown, which was inconsistent with previous seated shot-put studies indicating that all the release factors were associated with the distance thrown [12,14]. Moreover, no significant intercorrelation was observed in that study among the release factors in seated shot-putters, which was also inconsistent with the previous studies showing a significant inverse relationship between velocity and release angle in shot putters without disability [3-5].
Beyond the physical capabilities already described, body composition seems to have an impact on shot-put performance [15]. The ideal body composition for these athletes maximizes strength and power while minimizing excess body fat. Carrying excess body fat can negatively affect shot-put performance by reducing the strength-to-weight ratio, increasing fatigue, and limiting the range of motion. On the other hand, having a high amount of lean muscle mass can improve strength and power output. Therefore, shot put athletes typically have a higher percentage of muscle mass and a lower percentage of body fat.
To the best of our knowledge, no other investigation tried to study the association between 1RM and shot-put strength components. Thus, the present investigation aimed to evaluate the association among the 1RM test in the bench press (BP), the trunk rotation (TR), and the throwing distance of the adapted shot-put (TD). Additionally, the association between the body composition (Fat mass and Fat-free mass), the throwing distance of the adapted shot-put (TD), and 1RM results.
METHODS
1. Participants
The sample size was calculated using the GPower v 3.1.9.7 software [16] using the following parameters: Cohen's effect size of 0.70 for correlation bivariate normal model, error probability α=0.05, and β=0.80, resulting in a sample of 13 participants. The sample was then selected by convenience, with a total of 18 participants (23.50±3.00 years old), 14 males (23.43±2.98 years old), and 5 females (23.75±3.5 years old). Sample characterization is presented in Table 1. The inclusion criteria encompass i) men and women who perform physical activities regularly, with a minimum of 3 times a week of fitness training, ii) presented no injuries or any type of disabilities iii) be familiarized with the 1RM protocol. Professional shot putters or practitioners were excluded to avoid any bias regarding the purpose of this study. This research was approved by the University Ethics Committee (P12-S21-21.06.22), and the study protocol followed all the Declaration of Helsinki guidelines.
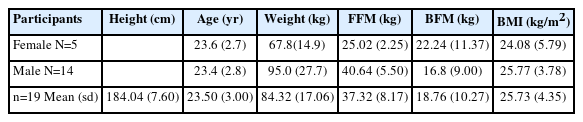
Participants’ characteristics presented in mean (sd)
2. Instruments and Procedures
Firstly, each participant signed an informed consent form and expressed the verbal agreement to carry out the protocol. The anthropometric evaluation was conducted with the height (cm) and body mass (kg) measurements. The body mass index (BMI) was calculated using the height and body mass assessed (BMI=body mass/(height2). Then the body composition data were collected using the Bioimpedance - Inbody 270 (InBody USA, Cerritos, CA, USA) calculated by transmitting an electrical impulse through the body. From the body composition characterization, it was included the analysis of free fat mass (FFM: also known as lean body mass, is the total weight of the body's non-fat tissues, including muscle, bone, and organs) and body fat mass (BFM: total weight of adipose tissue in the body).
Participants performed a specific warm-up for approximately 5 minutes, using an elastic band to help the muscle activation and mobility. Then, each participant performed familiarization trials with the movements required in the protocol. The TR exercise familiarization was assessed without load, with the arms extended together. In the BP assessment, the movement was performed with the barbell (without weight). After the familiarization trials and to assess bench press maximum repetition (BP1RM), it was used a barbell BPas can be seen in Fig. 1. To assess the trunk rotation maximum repetition (TR1RM), the multipower machine was used with the resistance cable coming from the horizontal position, with the cable moving parallel to the ground. The participant was seated and attached to a wooden box, the shoulders extended to 90°, and the handgrip was held with both hands together. The participants were requested to perform a TR from a neutral position keeping the arms extended during the whole execution. It was used a wooden box to simulate the official paralympic launching chair for the participant to sit in the TR exercise with the lower limbs tied up.
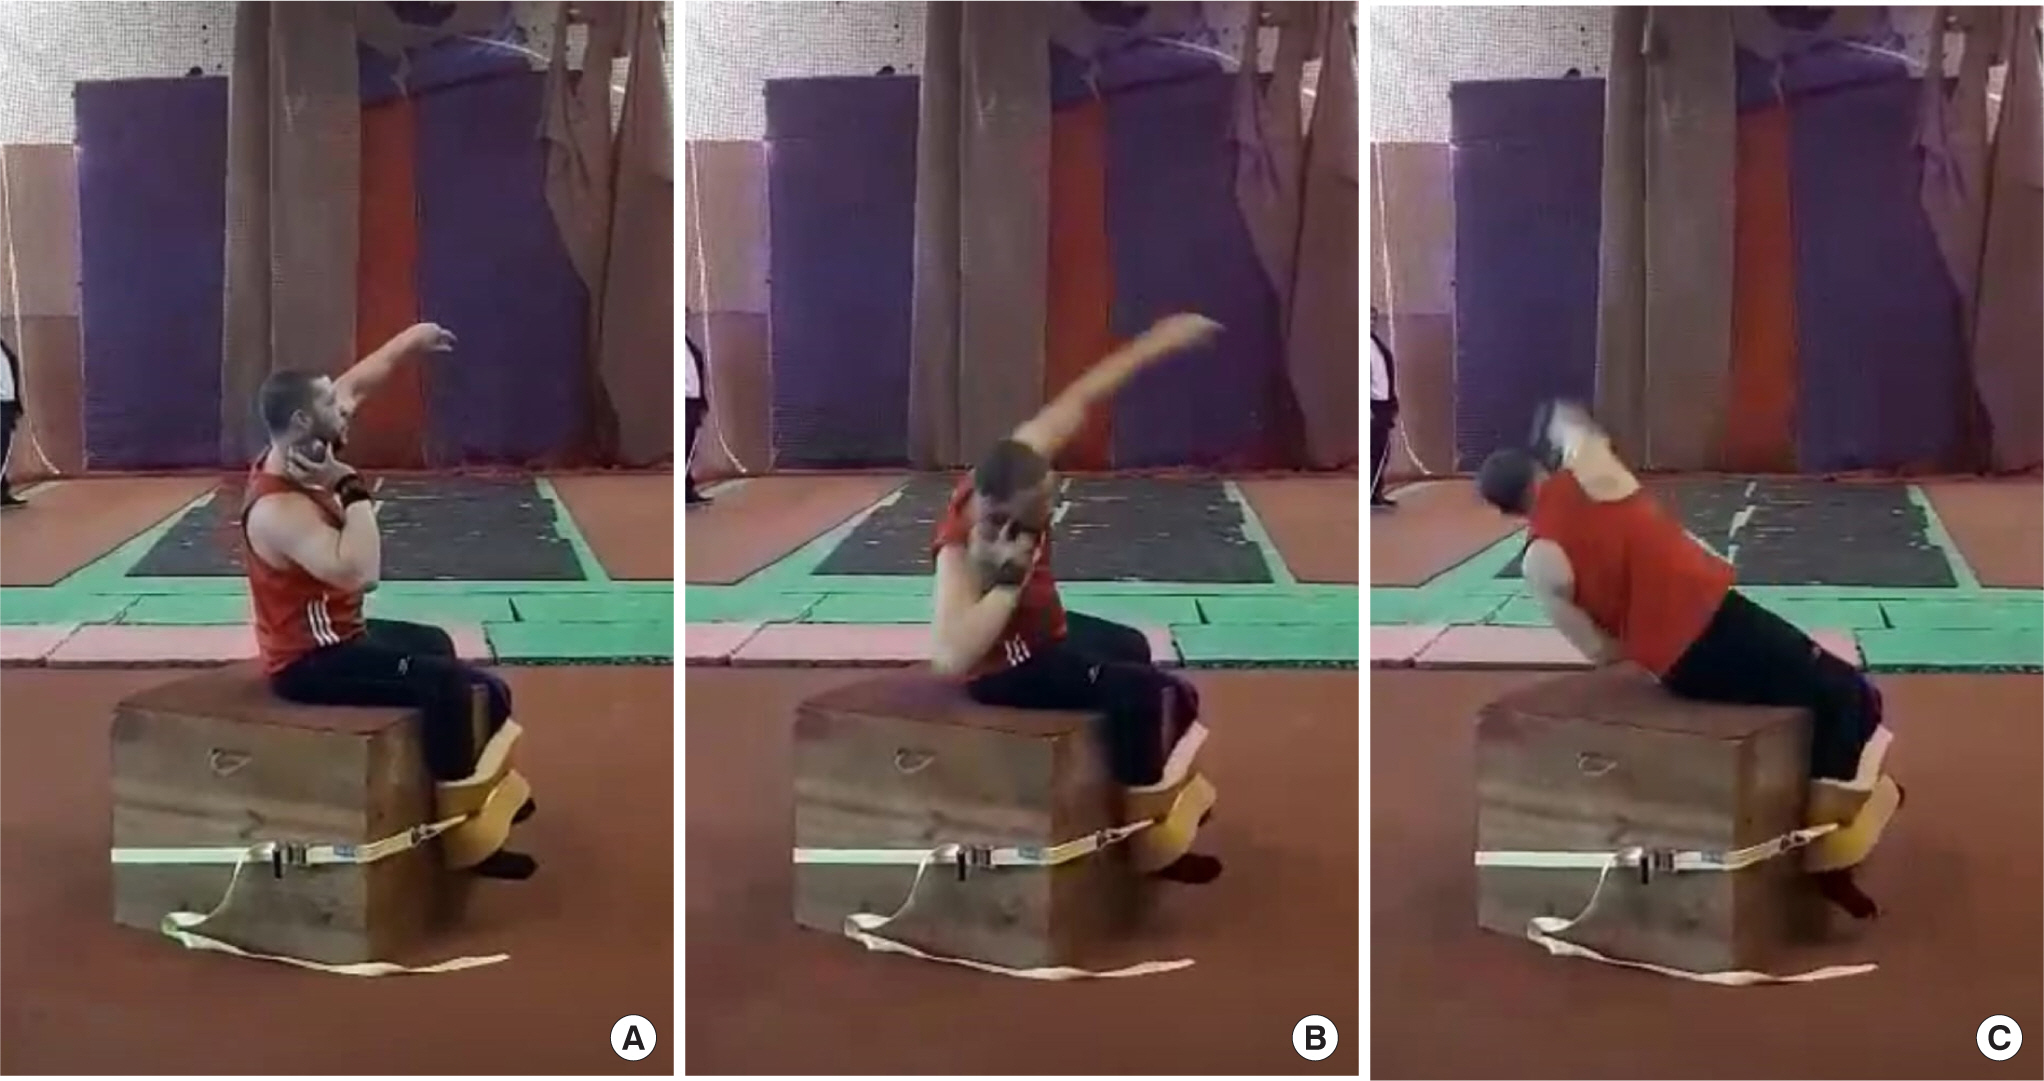
Adapted shot-put demonstration.
To measure maximal load, both in the BP and in TR, a load near to what they reported was their maximal load (according to their gym experience), was placed. With that load, the participant was asked to perform the highest number of repetitions possible until failure. After 5 min of rest, if there was more than only one repetition (thus, it was not finding the 1RM), the load was increased, according to the prediction equation proposed by Mayhew et al. [17].
For the adapted shot-put performance (Fig. 1A, B, and C) and after a warm-up, they were positioned in the wooden box as in the adapted shot-put, where the participant was attached to the box using a strap with buckles that avoid any movement of lower limbs during the throwing time. After familiarization with the simulated task, the participants had two attempts to reach the greatest throwing distance. For the throwing distance simulation, a measuring tape was used to measure the dropped distance of weight from the limit of the box until the weight arrived in a sandbox. The weight balls were 4 kg and 3 kg, coated with a layer of rubber, which is following Paralympic Committee regulations according to sex.
3. Statistical analysis
Descriptive analysis with mean and standard deviation was used to characterize the data. The variables’ normal distribution was confirmed by the Shapiro-Wilk and Levene tests. To verify the relationship between the variables, Pearson Correlations were used, and coefficients were categorized as r<0.30=weak; r=0.30 to 0.70=moderate; r>0.70=strong [18]. The linear regression model was performed to verify which were the predictors of the significant relationships found. The Statistical Package for Social Sciences (SPSS, version 28.0, IBM Corporation) was used, adopting an alpha level of significance of 5%.
RESULTS
Participants’ characteristics are presented in Table 1. Descriptive analyses were performed for the variables BP1RM, TR1RM, and TD, and the means and standard deviations are presented in Table 2.
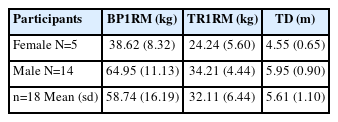
Mean (SD) of 1RM in bench press. trunk rotation and throwing distance of all participants
Pearson's correlation values are presented in Table 3. The results showed a positive and significant correlation between the TD and 1RM results for both exercises (BP1RM, p =.040; and TR1RM, p =.002) and with the amount of FFM (p =.045). FFM showed a positive and significant correlation with both 1RM exercises (BP1RM, p =.034; and TR1RM, p =.003). The BFM results demonstrated an inverse correlation only with the BP1RM (p =.035).
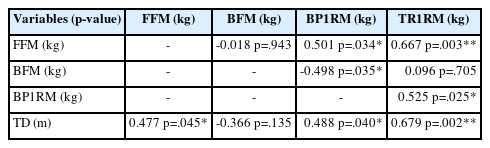
Pearson's correlation values among variables
Analyzing the predictors of these relationships among variables shown in Table 4, a simple linear regression was used to test if BP1RM and TR1RM significantly predicted the throwing distance. If found statistically significant results (R2 = 0.485, F (2,15)=7.067, p =.007) but only TR1RM significantly predicted TD (β=0.583, p =.017). Also, if FFM and BFM significantly predicted the BP1RM, which was confirmed (R2 = 0.456, F (2,15)=6.288, p =.010) but only FFM significantly predicted BP1RM (β=0.669, p =.003). Finally, if FFM and BFM significantly predicted the TR1RM, and it was also confirmed (R2 = 0.490, F (2,15)= 7,220, p =.006), both FFM and BFM significantly predicted TR1RM (β= 0.492, p =.017; β=-0.489, p =.018 respectively).
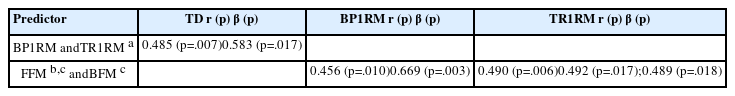
Predictors of interactions among variables
DISCUSSION
This study aimed to evaluate the relationship among the 1RM in the BP and the TR, and body composition with the adapted weight throwing distance. Regarding body composition, it was found that FFM was positively correlated with both 1RM tests and TD. Hence, BFM was negatively correlated with BP1RM. Both 1RM exercises showed a significant and positive correlation with TD. The TR1RM showed to be the main predictor of TD. Regarding body composition, both FFM and BFM predicted the TR1RM and only FFM predicted the BP1RM. Therefore, it seems that strength and conditioning programs that include exercises of BP and TR are crucial to achieving better results on adapted shot-put performance.
According to the influence of BP1RM and TR1RM exercises in the TD, the results showed a moderate and strong correlation, respectively, and the main predictor was the TR1RM exercise. This last movement has a higher influence on the adapted shot-put execution, which could suggest that the 1RM predicts how far they can throw the weight. Hence, TR seems a crucial aspect of shot-put performance, since the ability to generate and transfer rotational force to the upper body is essential for maximizing the distance of the throw. Studies have shown that greater rotational velocity is related to higher release velocities, longer throwing distances, and greater overall performance [12,14]. BP1RM showed a moderate correlation with TD. Those results suggest that although there is a strong correlation between the TR and TD, the strength of specific muscles, such as the pectoralis muscles, is also associated with the TD. Takanashi et al. [19] analyzed the correlation between chest muscle strength and TD and found that BP was important among female discus throwers.
Body composition showed influence on BP1RM and TR1RM, with strong and moderate correlations, respectively. One possible explanation is that muscle power could be determined by two fundamental components; rate of force development and muscle cross-sectional area. This last component is directly related to anthropometric variables [20]. A recent study found that FFM variables are related to 1RM values, with a higher power found with the local FFM for unilateral and multi-joint exercises. Nevertheless, for all resistance exercises, there was a stronger correlation with the overall body FFM, indicating that when a greater amount of muscle mass is involved in performing an exercise, the regional impact of FFM seems to be reduced [20]. The study found that 75.7% of the strength observed in the BP exercise among males can be attributed to variations in arm cross-sectional area, BMI, and fat percentage, with a standard error of 12.1 kg in the prediction. In both males and females, and across different levels of strength, there was a stronger correlation with lean mass, while moderate correlations were observed with height, body weight, arm circumference, and chest circumference, as reported in [21].
This study had some limitations. Firstly, the technique of launching the adapted weight is complex to be performed by participants who are not familiarized with the required patterns of movement. It was unclear whether participants who were not disabled athletes used complementary muscles, which may have affected the results. Furthermore, our sample included individuals who were not trained in this modality, which may have impacted their degrees of freedom and negatively affected their movements. Moreover, the limited number of women made the comparison between sexes impossible to be conducted. Finally, the research was conducted in a country where there are very few adapted shot-put athletes. Therefore, the sample had to include participants without experience and disabilities, which may have had an influence on the results. Despite the limitations of our investigation, our study tried to simulate the movement in order to gain a better understanding of how body composition and 1RM performance influence TD in a simulated environment for adapted shot-put.
The preliminary results need to be confirmed in future investigations using people with disabilities and shot-put athletes. Future research must be applied in this context to improve scientific knowledge about paralympic modalities, and it might include the kinematics of the throwing movement, and the strength of other muscles involved in the movement and compare our results with people with different disabilities and with athletes of this modality. Therefore, based on our findings, coaches should prioritize the development of maximal strength in BP and TR exercises, while also considering athletes’ body composition, specifically their FFM. Thus, by designing personalized strength and conditioning programs that include these exercises, coaches can help adapted shot-put athletes achieve better results and enhance their performance in the sport.
CONCLUSION
This investigation has provided valuable insights into the factors that contribute to improved performance in adapted shot-put. The significant correlation between TD, BP1RM, TR1RM, and FFM highlights the importance of strength and conditioning programs that prioritize exercises like BP and TR. Therefore, the identification of BP and TR as critical strength exercises for improved throwing distance further supports the need for coaches to focus on developing their athletes' maximal strength.
Notes
The authors declare that they do not have conflict of interest.
AUTHOR CONTRIBUTION
Conceptualization: D Soares; Data curation: D Soares; Formal analysis: F Flôres; Funding acquisition: AF Silva; Methodology: D Soares; Project administration: D Soares; Visualization: F Flôres, D Soares; Writing - original draft: F Flôres; Writing - review & editing: F Flôres, D Soares.