Better Option for Improving Metabolic Syndrome: Consideration of the Amount and Duration of Resistance Exercise or Physical Activity
Article information

Abstract
PURPOSE
Physical activity (PA) improves the metabolic syndrome (MetS) risk. According to a recent revision of the PA guidelines for Americans (2018), healthy adults should participate in PA for >300 min/week for additional health benefits. In addition, it is recommended to participate in resistance exercise (RE) ≥2 days/week. This study aimed to determine whether increasing the PA duration or adding RE is more efficient in improving MetS.
METHODS
Data from the 2016-2018 Korean National Health and Nutrition Examination Survey were used. The logistic regression and general linear models in the complex sample were performed with a sample of 8,662 Korean adults aged 19–65. According to the metabolic equivalent task (MET), PA intensity was categorized as low-(LP; <600 MET-min/week), moderate-(MP; 600-3,000 MET-min/week), and high-level PA (HP;≥3,000 MET-min/week). Furthermore, duration was categorized as high duration (HD) and low duration (LD), while RE was categorized more 2 days/week RE (MR) and less 2 days/week RE (LR).
RESULTS
Compared with LP-LR the MR groups showed a significantly low odds ratio (OR) of MetS (p<.05 respectively), whereas the LR groups had no significant OR (p>.05 respectively). Compared with LP-LD, HP-HD had significantly low OR (p<.05), whereas other groups had no significant OR (p>.05 respectively).
CONCLUSIONS
Frequent RE decreases the OR of MetS and is not dependent on PA intensity. To efficiently reduce the OR of MetS in Korean adults, participating in frequent RE, rather than simply prolonging PA, is recommended; although, increasing PA duration can have positive effect in HP. In terms of the reduction of the MetS, more than 300 min/week of PA is unlikely to achieve additional health benefits.
INTRODUCTION
Metabolic syndrome (MetS) is a complex metabolic disorder charac-terized by excess abdominal obesity, hypertension, high fasting glucose levels, and low high density cholesterol (HDL-C) and high triglyceride (TG) levels and may progress to diseases such as type 2 diabetes mellitus and atherosclerosis [1,2]. A patient with ≥3 metabolic disorders is diag-nosed with MetS [3]. According to the global epidemic of overweight and sedentary lifestyles, the prevalence of MetS increased with a global health problem [4].
It is well known that physical activity (PA) prevents unhealthy weight gain and obesity and improves the risk factors for chronic diseases as well as MetS [5]. PA consists of a variety of activities, including aerobic and resistance exercise (RE), and many studies have been investigated the optimal frequency, intensity, and duration of PA for improving MetS [6-9]. It is known that the risk of MetS may be reduced through aerobic exercise, which is the component of PA, through improving the obesity [10]. Furthermore, RE, one of the PA, also improves the MetS by en-hancing the lipid metabolism [11]. Although there were relatively rare large-scale evidences regarding whether PA and/or RE should be promoted to get beneficial effects on the MetS and its components, it was revealed that combination of aerobic exercise and RE have various positive effects on the individual components of MetS [12].
Interestingly, a recent revision of the PA guidelines for Americans rec-ommends that adults perform at least 150 minutes of moderate-intensity PA and participate for ≥300 minutes to gain more health benefits [13]. However, the beneficial effects for PA over 300 minutes are still unclear. Another recommendation to participate in RE more than twice a week [13]. The skeletal muscles are closely related to insulin resistance, and RE plays an important role in developing them [14]. Improving insulin resistance can prevent various metabolic diseases, and participating in RE can prevent various metabolic diseases [15].
Despite numerous studies on the beneficial effects of aerobic exercise or PA on improving MetS, several issues of PA or RE remain. For exam-ple, racial disparities occur in the prevalence of MetS [16,17]. Most of the studies and guidelines on the importance of the role of PA are mainly from Europe or the United States [13,18,19]. In addition, although few studies have investigated effects of PA and RE on MetS [20,21], the optimal duration of PA and the effects of RE with PA level on MetS have not been fully investigated. However, it is limited to identify the individuals or gender-specific characteristics that may affect their physical activities. Therefore, to examine the role of PA and RE in effect on the MetS, this study used a large-scale and reliable dataset from a national survey con-sist of the questionnaire based on physical movement habit of participants. Thus, this study aimed to determine which is more efficient for improving MetS in Korean adults, increasing the PA duration or adding RE.
METHODS
1. Participants
This study used data from the Korean National Health and Nutrition Examination Survey (KNHANES), which was conducted by the recom-mendations of the World Health Organization (WHO) and with the approval of the institutional review board of the Korea Centers for Disease Control and Prevention [22]. In addition, the statistical data of the KNHANES are representative of South Korea, which is extracted annu-ally by stratified, clustered, and systematic sampling. In this study, the 7th data of the KNHANES, where 24,269 people participated in 576 survey districts nationwide, from 2016 to 2018 were vertically merged and analyzed to increase statistical power. Before analysis, data of individuals who had cardiovascular diseases or cancer did not complete ma-jor surveys, or were pregnant women were excluded. The final data of 8,662 (unweighted cases) participants aged ≥19 and ≤65 years of age and who completed clinical examinations and questions in the KNHANES-related PA were used according to the purpose of this study (Fig. 1). The demographic characteristics of participants are shown in Table 1.
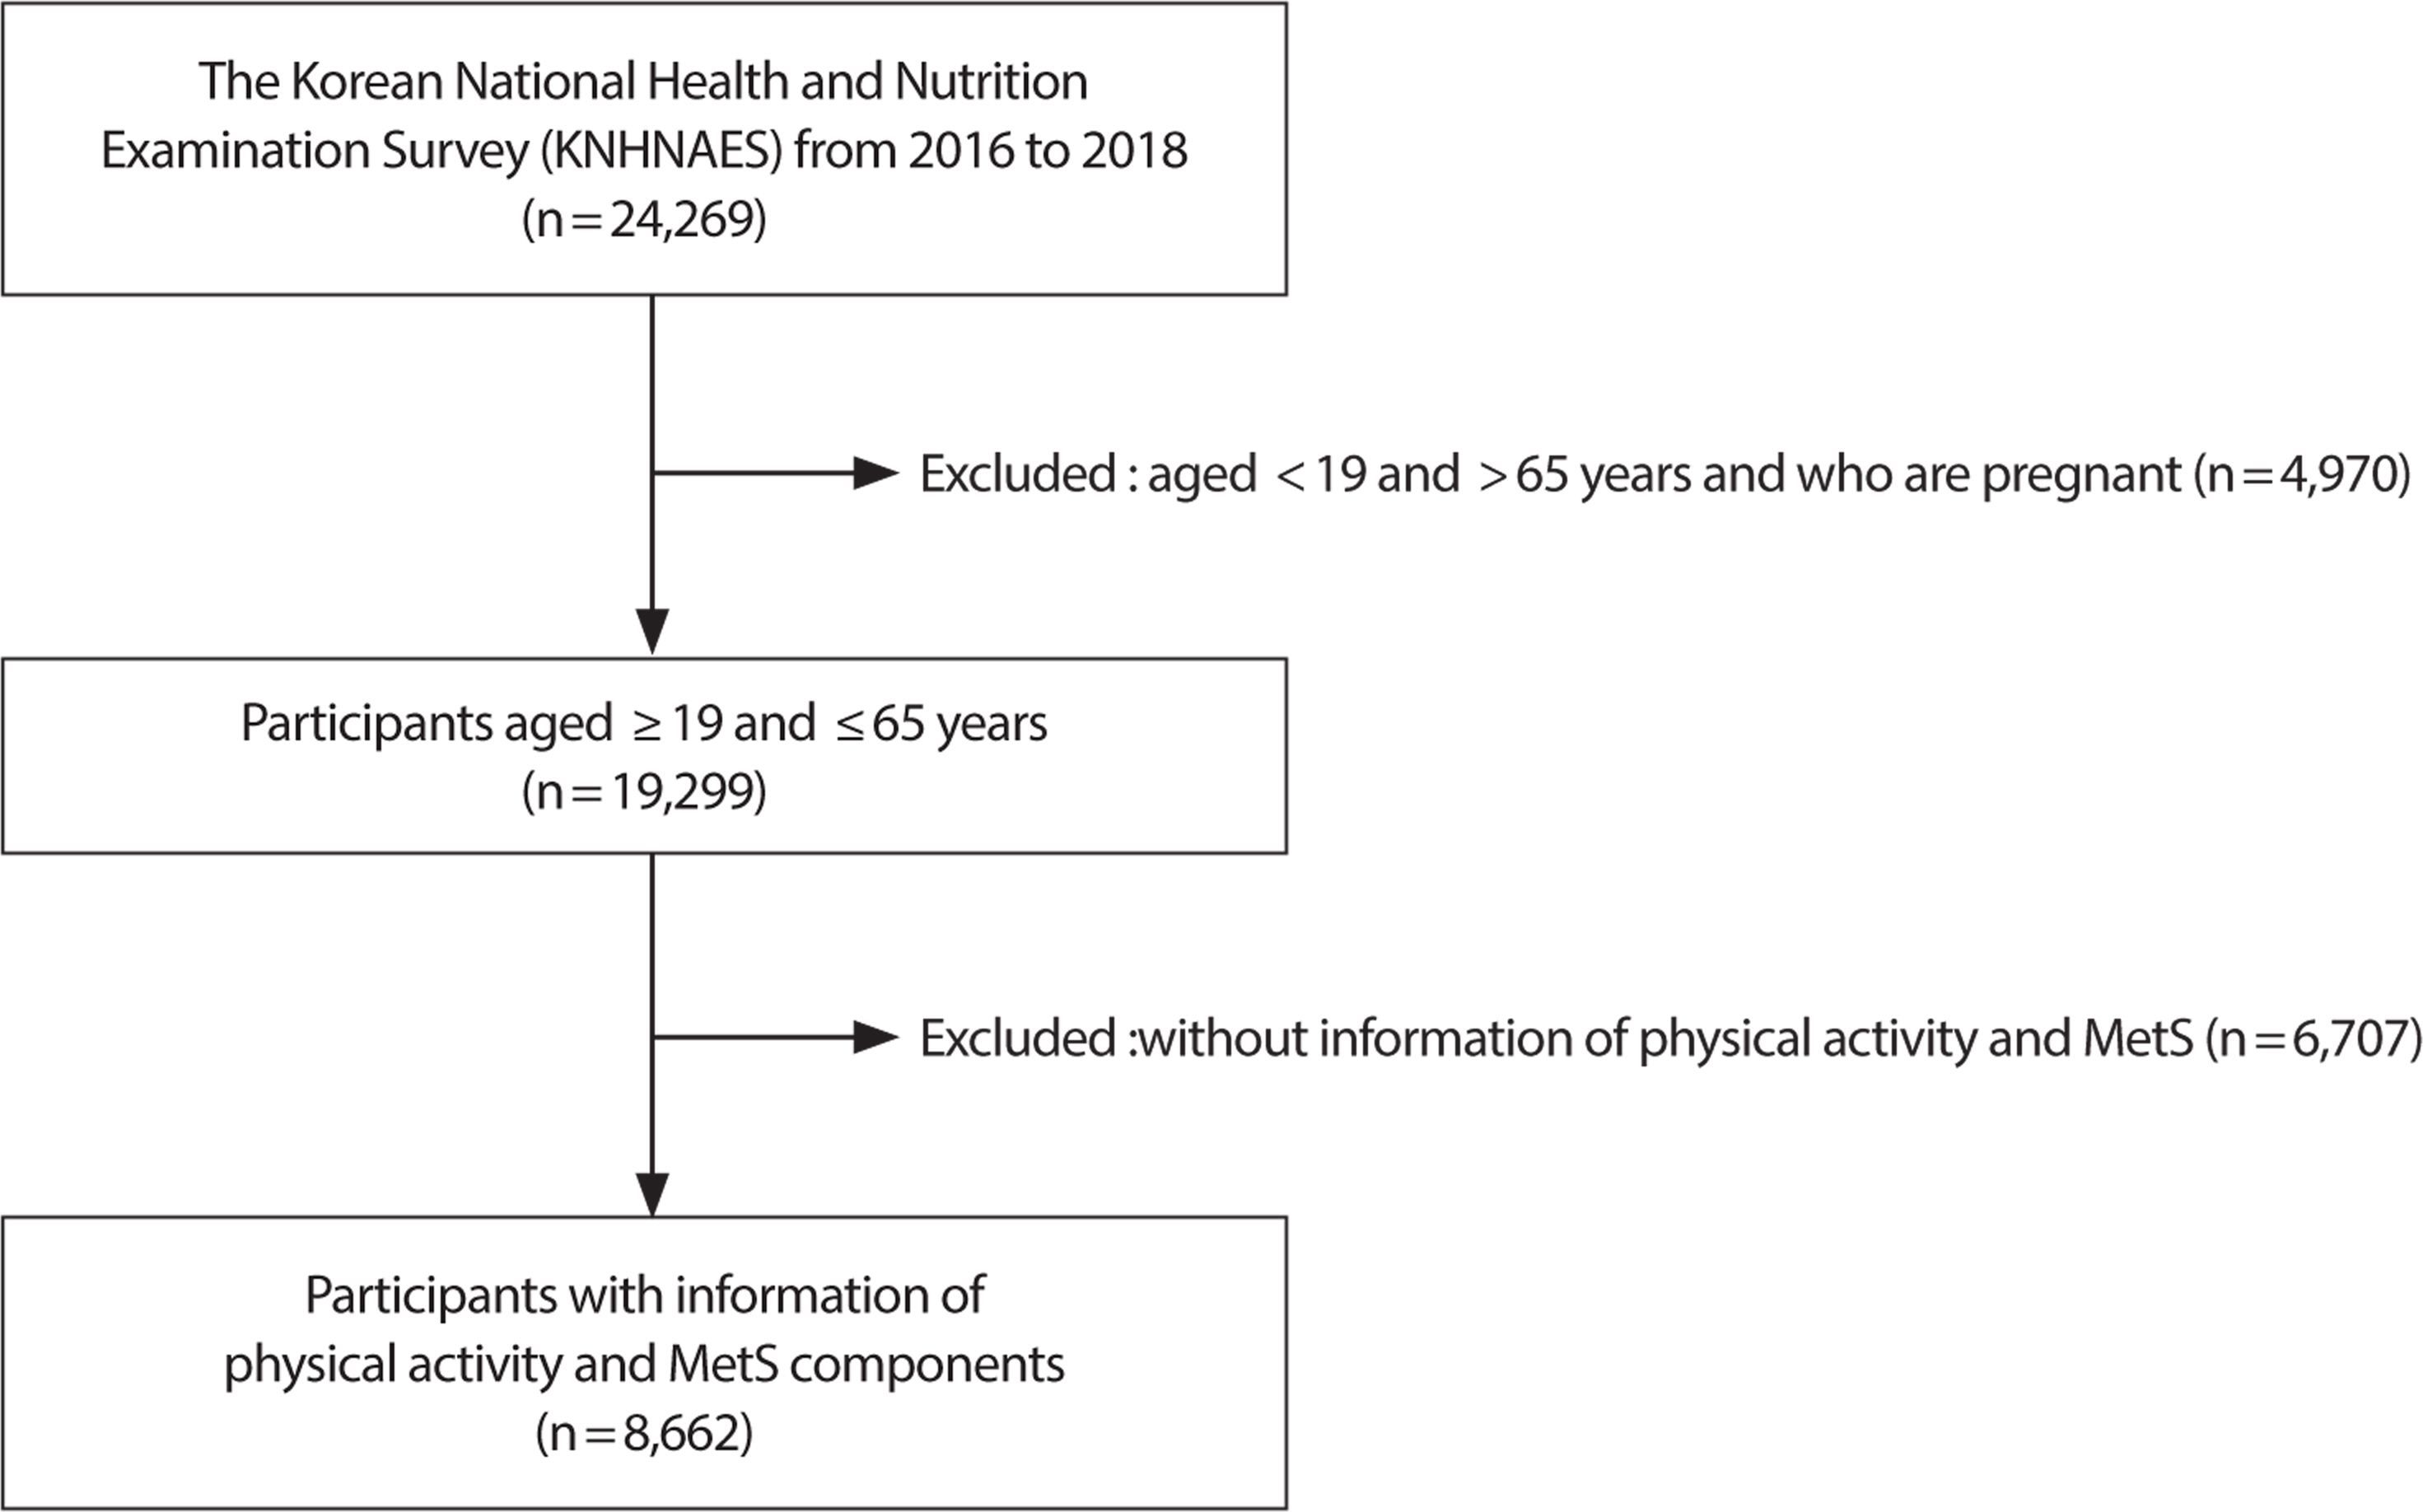
Flow diagram of the study participants.
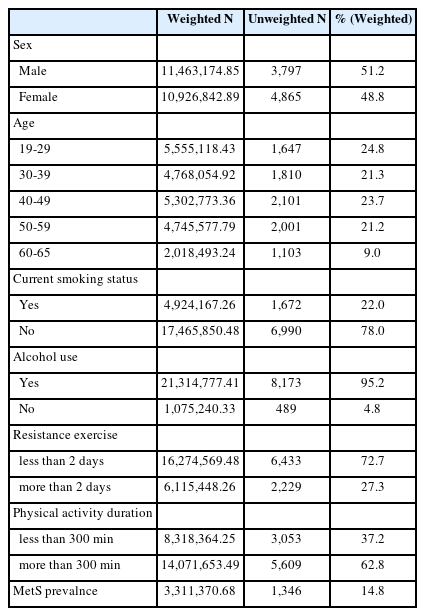
Basic characteristics of study participants in this study according to PA level
2. Research instrument
The sampling frame of the KNHANES used the data from the latest Population and Housing Census available at the time of sampling design. Through this process, the representative samples were collected from South Korean citizens aged ≥1 year, which was the target population. The KNHANES consists of a household member confirmation survey, a health survey, a medical examination survey, and a nutrition survey.
3. Physical activity and resistance exercise
Since 2014, the KNHNS has analyzed the populationʼ s physical activity using Global Physical Activity Questionnaire (GPAQ) to accurately measure and interpret the quantity of physical activity per area (work, travel, and recreation activities) and take into account the intensity of physical activity. In this study, the GPAQ was standardized to measure the PA level of people worldwide. PA was assessed by the metabolic equivalent task (MET)-minutes of GPAQ guideline [23]. During work and at leisure, PA was calculated as the sum of walking, moderate, and vigorous MET-minutes in a week. Walking, moderate, and vigorous MET-minutes were calculated as follows:
- Occupational vigorous PA (MET)=8.0×vigorous PA (day/week)×1-day vigorous PA (min/day)
- Occupational moderate PA (MET)=4.0×moderate PA (day/week)×1-day moderate PA (min/day)
- Recreational vigorous PA (MET)=8.0×vigorous PA (day/week)×1-day vigorous PA (min/day)
- Recreational moderate PA (MET)=4.0×moderate PA (day/week)×1-day moderate PA (min/day)
- Place movement (MET)=4.0×place movement (day/week)×1-day place movement (min/day)
- Total=occupational vigorous PA+occupational moderate PA+ recreational vigorous PA+recreational moderate PA+place movement
The level of PA was classified into three groups based on the WHO guidelines, low-level PA (LP; <600 MET - min/week), moderate-level PA (MP; 600-3,000 MET - min/week), and high-level PA (HP; ≥3,000 MET - min/week). Furthermore, duration was categorized as high duration (HD; ≥300 min PA per week) and low duration (LD; <300 min PA per week), whereas RE was categorized as ≥2 days RE per week (MR) and <2 days RE per week (LR).
4. Metabolic syndrome
According to the National Cholesterol Education Program Adult Treatment Panel Ⅲ [3], the criteria for MetS include waist circumference (WC), blood pressure (BP), fasting glucose, high-density lipoprotein cholesterol (HDL-C), and triglyceride (TG). We used the criterion of the Asia-Pacific Region for WC instead of the original [24]. MetS was defined as the presence of ≥3 of the following components: (i) WC ≥90 cm for men and ≥80 cm for women; (ii) systolic blood pressure (SBP) ≥130 mmHg or diastolic blood pressure (DBP) ≥85 mmHg; (iii) fasting glucose >100 mg/dL; (iv) HDL-C <40 mg/dL for men and <50 mg/dL for women; and (v) TG ≥150 mg/dL.
5. Statistical analysis Metabolic syndrome
All analyses were performed using IBP SPSS for Windows version 25.0 (IBM Corp., Armonk, NY, USA). Because stratified, clustered, and systematic sampling methods were used in KNHANES, sampling weight with complex sample procedures were applied to decrease the bias associated with nonresponse and non-coverage of the population. Logistic regression and general linear model were performed by adjusting for covariates such as sex, age, current smoking status and alcohol use. Statistical significance was considered for p-values <.05.
RESULTS
1. Participant characteristics
Table 1 presents the baseline characteristics of the participants. Among 8,662 participants, 2,229 (27.3%) participated in RE ≥2 days a week, and 5,609 (62.8%) participated in PA for ≥300 minutes per week. Furthermore, 1,346 (14.8%) developed MetS.
Tables 2 and 3 show the differences in MetS and MetS components according to the PA intensity with RE level or PA duration. In Table 2, participants were categorized into six groups based on PA intensity and RE level. Significant differences in MetS prevalence and MetS components, excluding SBP and DBP, were identified. In Table 3, participants were categorized into six groups based on PA intensity and duration. Significant differences in MetS prevalence and WC among MetS components were observed.
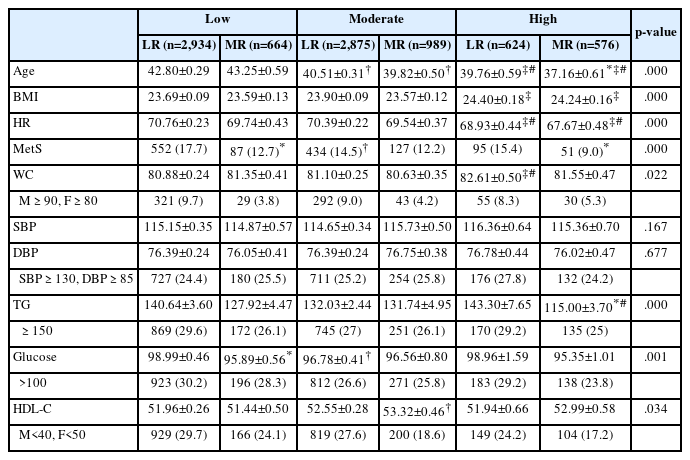
Basal characteristics of participants according to the PA level and RE level
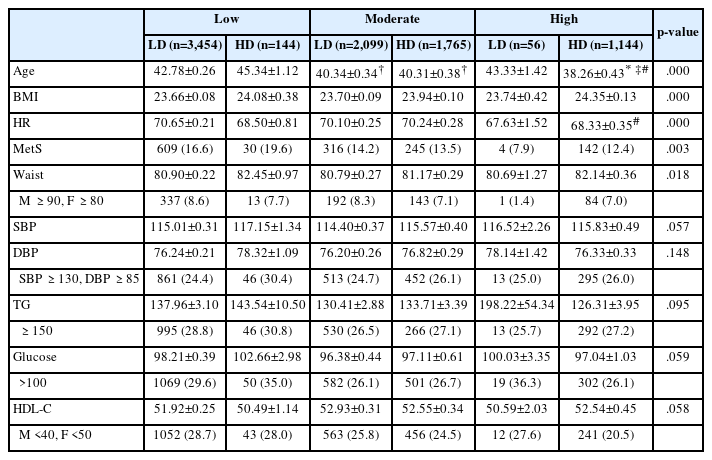
Basal characteristics of participants according to the PA level and duration level
2. Effects of physical activity duration and intensity on the metabolic syndrome
The results of the complex samples logistic regression analysis of the MetS prevalence and MetS components according to the PA level and duration are shown in Fig. 2 and Table 4. This model was adjusted by sex, age, current smoking status, and alcohol use. The prevalence of MetS was significantly lower than the baseline values for HP-HD (0.756, 95% confidence interval [CI) 0.597-0.957).
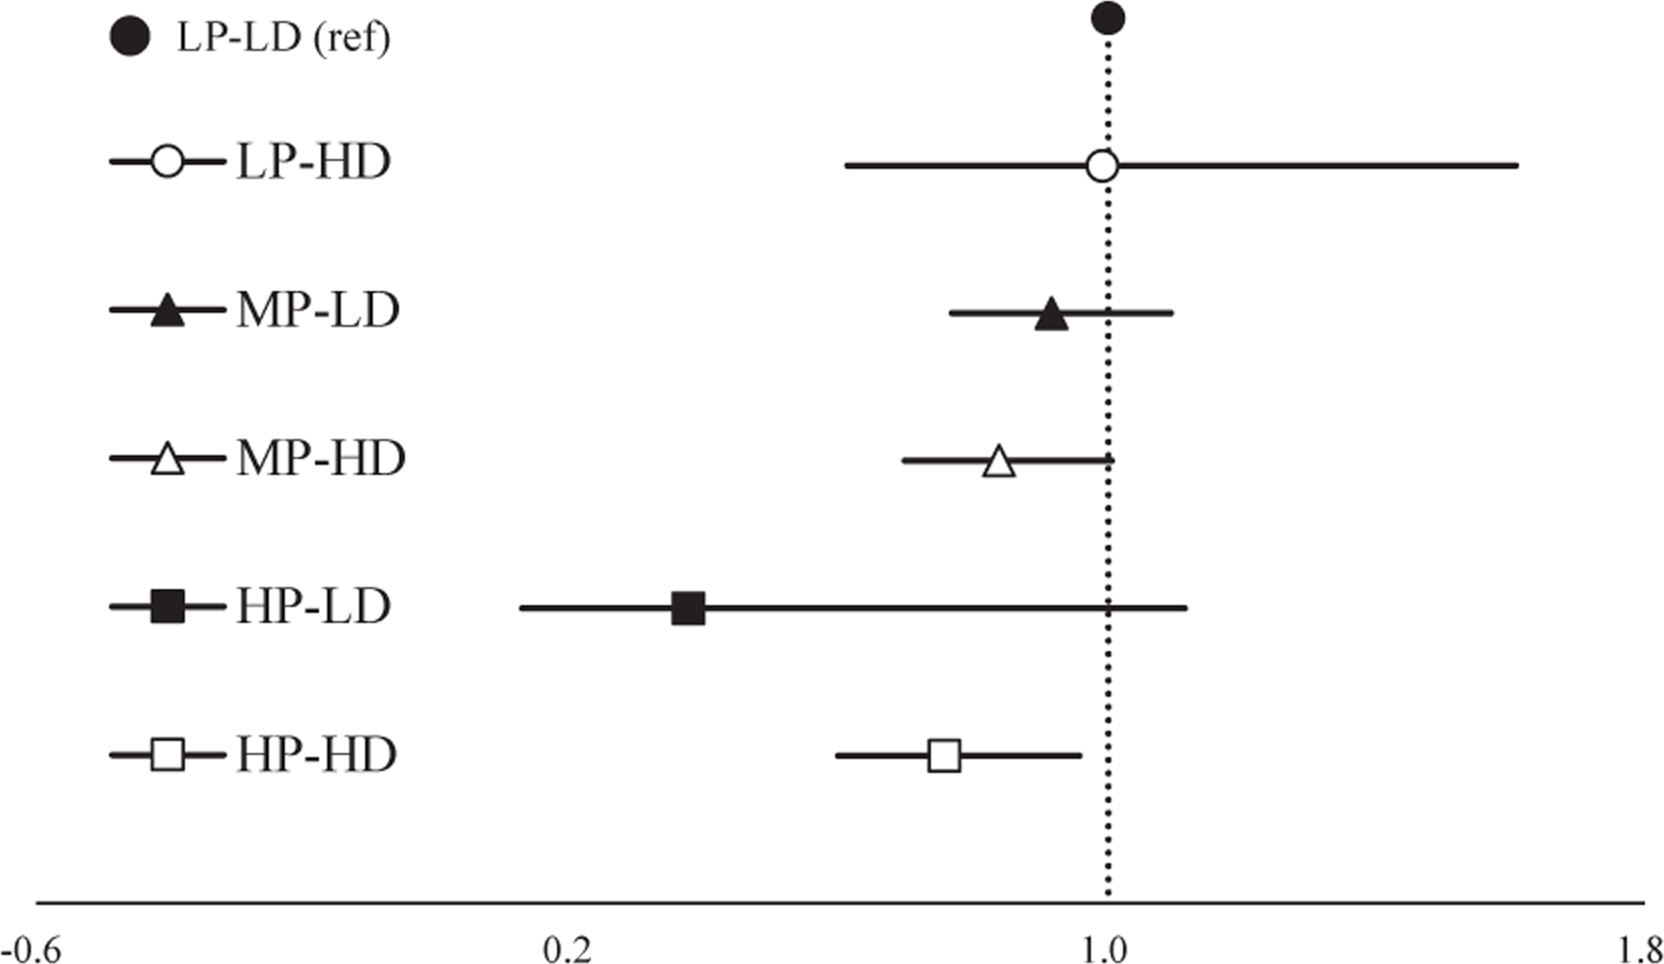
Odds ratio of metabolic syndrome according to physical activity level and duration.
LP, low level physical activity; LD, less than 300 minutes physical activity per week; HD, more than 300 minutes physical activity per week; MP, moderate level physical activity; HP, high level physical activity.
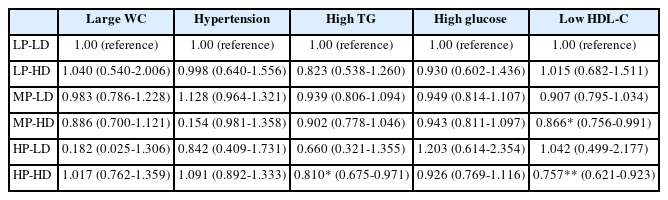
Odds ratios (95% CI) for MetS components according to PA and duration level
High TG odds ratio (OR) was significantly reduced for HP-HD (0.810, 95% CI 0.675-0.971). Low HDL-C OR were significantly reduced for MP-HD (0.866, 95% CI 0.756-0.991) and HP-HD (0.757, 95% CI 0.621-0.923).
3. Effects of resistance exercise and physical activity on the metabolic syndrome
The results of the complex samples logistic regression analysis of the MetS prevalence and MetS components according to the PA and RE levels are shown in Fig. 3 and Table 5. This model was adjusted by sex, age, current smoking status, and alcohol use. The prevalence of MetS was significantly lower than the baseline values for MR groups (HP-MR: 0.471, 95% CI: 0.332-0.669; MP-MR: 0.644, 95% CI: 0.509-0.815; LP-MR: 0.581, 95% CI: 0.435-0.776).
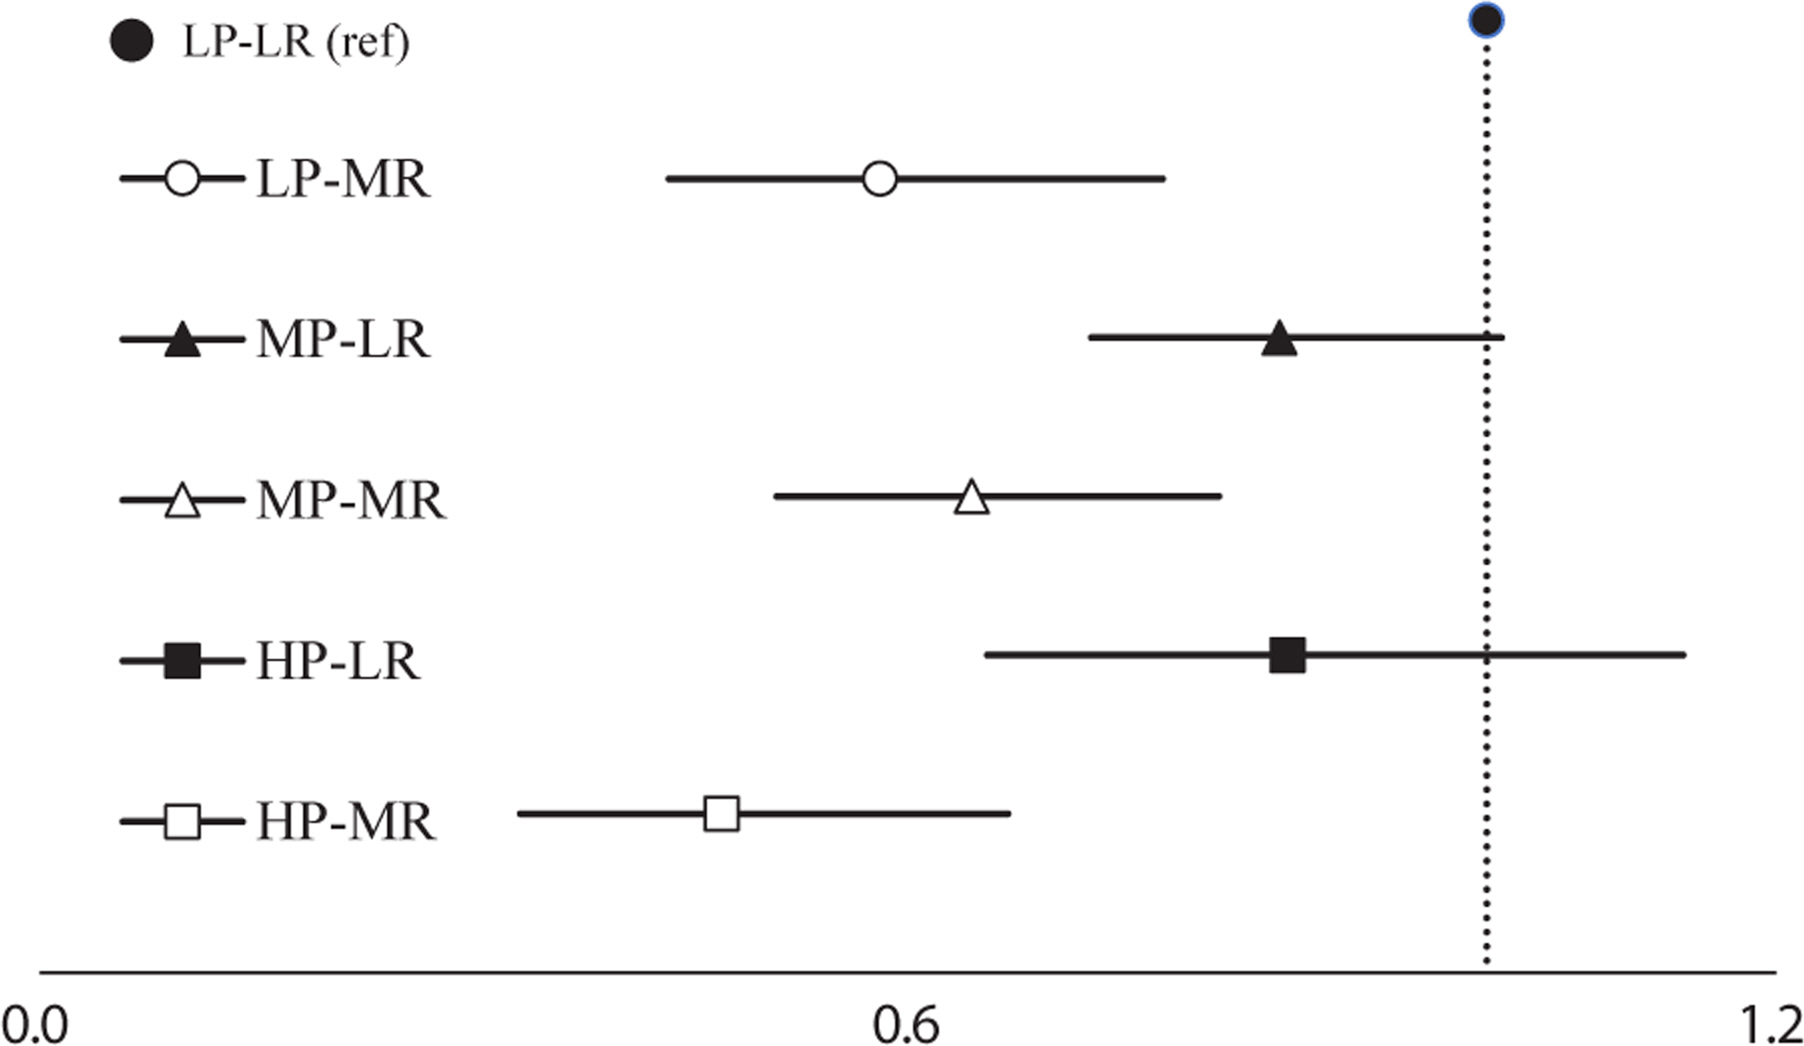
Odds ratio of metabolic syndrome according to physical activity level with resistance exercise participation.
LP, low level physical activity; LR, less than two days resistance training per week; MR, more than two days resistance training per week; MP, moderate level physical activity; HP, high level physical activity.
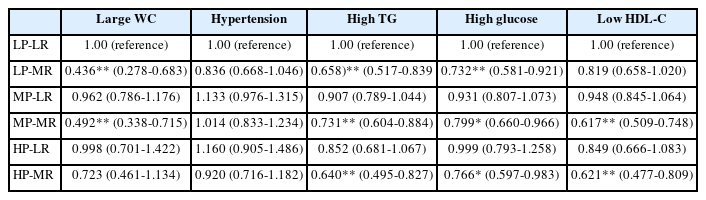
Odds ratios (95% CI) for MetS components according to PA and RE level
Large WC OR were significantly reduced for MP-MR (0.492, 95% CI: 0.338-0.715) and LP-MR (0.436, 95% CI 0.278-0.683). High TG (HP-MR: 0.640, 95% CI 0.495-0.827; MP-MR: 0.731, 95% CI 0.604-0.884; LP-MR: 0.658, 95% CI 0.517-0.839) and high glucose OR (HP-MR: 0.766, 95% CI 0.597-0.983; MP-MR: 0.799, 95% CI 0.660-0.966; LP-MR: 0.732, 95% CI 0.581-0.921) were also significantly lower than the baseline values for MR groups. Low HDL-C OR were significantly reduced for MP-MR (0.617, 95% CI 0.509-0.748]) and HP-MR (0.621, 95% CI 0.477-0.809).
DISCUSSION
The KNHANES is a nationally representative survey that provides data on the health and nutritional status of the Korean population. This study investigated the relationship between RE and PA with MetS. The results showed that both RE and PA had a beneficial effect on MetS, with RE having a greater effect.
Significant differences were found between the PA level, RE level, and PA duration in MetS. Except for BP, other MetS components demon-strated significant differences according to the PA and RE levels. However, only the WC showed significant differences according to the PA level and duration. The results of complex samples logistic regression analysis revealed that frequent RE participants showed a significantly decreased MetS risk and risk for some MetS components. Although prolonged PA duration also decreased MetS risk and risk for some MetS components, HP-HD showed a significantly decreased risk of MetS, high TG level, and low HDL-C level, and MP-HD showed a significantly decreased risk of low HDL-C.
Previous studies have reported that PA negatively associated with the prevalence of MetS [25,26]. Recent studies have shown that PA or aerobic exercise can improve various components of MetS, including body composition [27,28], insulin resistance and lipid metabolism [29-31], and cardiovascular function [31,32]. Specifically aerobic exercise reduces chronic inflammation, increases energy expenditure, and increases expression of PGC-1a, which protects against mitochondrial diseases such as apoptosis and oxidative damage [28-31]. Several studies comparing PA intensity and duration in improving metabolic function have been conducted [19,33]; however, studies on the combined effects of PA intensity and duration remain insufficient. Despite the importance of PA intensity, PA duration also plays an important role in reducing the prevalence and risk of MetS. Churilla & Fitzhugh (2012) reported that those who met the recommendation of PA duration have reduced MetS risk, and inves-tigators suggested that not only the intensity but also the duration of PA may affect MetS risk [19]. In the present study, duration does not affect in the LP group; however, in the MP and HP groups, HD improved the MetS components compared with LD. In this respect, for the MetS components, prolonged PA duration appears to be most effective when ac-companied by at least moderate levels of PA intensity.
Although the HP-LD group did not have a significantly low OR, many previous studies have reported that high-intensity PA improves MetS. Laaksonen et al. [18] reported the benefit of high-level PA on the risk of MetS, and Laursen et al. [33] suggested that high-intensity PA is important in reducing MetS. Interestingly, our findings were consistent with those of Johnson et al. [34] who reported that low-volume vigorous-intensity group had no significant improvement in MetS components compared with the inactive group. Similar to the study by Johnson et al. [34] the results of the present study are considered influenced by the effect of low frequency in the HP-LD group or by the large deviation because of the small sample size. Thus, experimental studies analyzing various variables are needed to solve the problem in the future.
RE such as muscular strengthening exercise is an effective strategy for improving muscle mass and strength and improving insulin sensitivity and glycemic control [5,35]. Specifically, increased muscle mass has positive effect on total activity of glycogen synthase, protein content of GLUT4, and AMP-activated protein kinase, which in turn improves lipid metabolism and insulin sensitivity [5,35]. Our findings suggest that the prevalence of MetS among Korean adults in MP or HP is not significantly lower than that of the LP-LR group if they do not participate in RE. According to Bateman et al. [20] performing aerobic and resistance training in combination, rather than performing them alone, was the most effective. Specifically, when only resistance training was performed, only the peak oxygen consumption and strength were significantly increased, and when only aerobic training was performed, only the body mass, peak oxygen consumption, and TG were significantly improved.
However, when aerobic and resistance training were performed in combination, body mass, peak oxygen consumption, strength, TG, WC, and BP were significantly improved [20]. These results appear to be simi-lar to our findings. In this study, TG and glucose were improved in the group that performed the recommended level of RE along with the increase in PA level, and WC and HDL-C were independent of the PA level, but improved when RE was added. This finding is consistent with those of previous studies that reported a negative relationship between muscular strengthening PA and MetS [5,15], which may be due to improved insulin resistance and glycemic control by the involvement of more muscles. This suggests that participation in RE as a long-term strategy to improve the MetS may lead to mechanisms that improve lipid metabolism and consequently reduce the prevalence of MetS. Interestingly one previous study found that men who had significantly reduced physical activity due to the COVID-19 pandemic but continued to participate in RE reported lower rates of abdominal obesity than those who did not participate in RE [36]. These findings are in line with those reported in the present study, where higher RE frequency was associated with protection against MetS even at the level of PA decreased.
This study has some limitations. First, the cross-sectional design prevents the inference of causality. Second, data using questionnaires that have potential recall bias for responses regarding PA patterns may have limited accuracy. Finally, we could not completely rule out the possibility of residual confounding because of unmeasured covariates, such as di-etary factors.
CONCLUSION
In conclusion, participating in frequent RE decreases the OR of MetS prevalence, and it is not dependent on PA intensity. Although the analysis was conducted using a large-scale data set, the proportion of people with high physical activity level was still low. Moreover, while our findings suggest the importance of RE, paradoxically, ratio of participation in RE is insufficient. Therefore, to efficiently reduce the OR of MetS in Korean adults, participation in RE should be actively promoted rather than simply prolonging the PA, although increasing the PA duration can positively affect HP group.
Notes
The authors have no conflicts of interest to declare for this study. This research did not receive any specific grant from any funding agencies in the public, commercial, or not-for-profit sectors.
AUTHOR CONTRIBUTION
Conceptualization: MK Kim; Methodology: MK Kim, HD Jo; Formal analysis: MK Kim, HD Jo; Data Curation: MK Kim, HD Jo; Writing - Original Draft: MK Kim, HD Jo; Writing - Review & Editing: MK Kim, HD Jo.