미토콘드리아 산소호흡 측정방법
How to Measure Mitochondrial Oxygen Respiration
Article information

Trans Abstract
PURPOSE
With the widespread of mitochondrial function, the need to accurately quantify and comprehend mitochondrial O2 respiration has gained prominence within the physiological and pathological spheres. Various in situ, in vitro, and in vivo approaches have been available to investigate numerous aspects of mitochondrial O2 consumption. This review aims to provide a specific method for researchers to consider in examining mitochondrial O2 respiration using permeabilized or homogenized tissues. These techniques allow direct access to mitochondrial O2 respiration, facilitating an exploration of mitochondrial bioenergetics under well-defined substrate conditions.
METHODS
Here, we present a method for measuring mitochondrial O2 consumption in permeabilized or homogenized tissues using high-resolution respirometry (Oroboros Oxygraph-2K, Oroboros Instrument).
RESULTS
A high-resolution respirometry provides the most direct way to assess mitochondrial O2 respiration with interpretations based on specific modeling approaches.
CONCLUSIONS
As many diseases are closely associated with mitochondrial dysfunction, ongoing advancements in this methodology may provide researchers with exciting and novel opportunities for finding the potential role of mitochondria in the etiology and treatment of various diseases.
서 론
미토콘드리아는 세포 내 소기관 중 하나로서 인체에서 매우 중요한 역할을 하는 필수적인 존재이다. 미토콘드리아는 골격근을 포함한 각종 장기의 에너지로 사용되는 아데노신삼인산(ATP)을 생산할 뿐만 아니라 산화 스트레스, 칼슘 항상성을 조절하는 데 중요한 역할을 한다[1-3]. 특히, 미토콘드리아는 세포호흡이 일어나는 장소로, 당과 지방과 같이 열량을 내는 영양소들을 산소를 이용하여 분해함으로써 ATP를 생성하고 세포 에너지 대사에서 중요한 역할을 수행한다. 따라서, 다양한 원인들로 인해 유발된 미토콘드리아의 기능부전(mitochondrial dysfunction)은 세포 내 에너지 대사에서의 문제를 유발시키고, 이는 여러 조직에서 미토콘드리아 관련 질병을 유발할 수 있는 원인 혹은 결과가 될 수 있다[4]. 미토콘드리아 기능장애 관련 질병으로는 비만, 당뇨병, 고혈압과 같은 대사질환부터 암, 알츠하이머, 파킨슨병, 그리고 근감소증 등과 관련성이 있다고 알려져 있다[5,6]. 이처럼 다양한 질병들이 미토콘드리아 기능부전과 연관이 있다는 것이 밝혀짐에 따라, 미토콘드리아의 기능을 측정하는 방법에 대한 연구자들의 관심이 상당히 높아지고 있는 추세이다.
1. 미토콘드리아 산소 호흡(mitochondrial O2 respiration)의 원리
미토콘드리아의 산화적 인산화(Oxidative Phosphorylation)는 전자전달계(Electron Transport Chain)를 따라 전자를 전달하고 산소 소비 및 ATP를 합성하게 된다. 미토콘드리아 tricarboxylic acid (TCA) 회로는 단백질, 탄수화물 및 지방을 nicotinamide adenine dinucleotide (NADH) 및 flavin adenine dinucleotide (FADH2)와 같은 화합물로 전환시키는데 관여한다. TCA 회로에서 NADH는 i) citric acid가 α-keto-glutarate로 전환, ii) 생성된 α-ketoglutarate가 succinate로 전환, iii) ma-late가 oxaloacetate로 전환될 때 생성되고, FADH2는 succinate가 fuma-rate로 전환될 때 생성된다. TCA 회로에서 생성된 NADH 및 FADH2는 미토콘드리아 내막에 위치한 호흡사슬 복합체 I (complex I) 혹은 복합체 II (complex II)로 전달되고, 복합체 I과 복합체 II에서 생성된 전자를 복합체 IV로 전달한다. 이때 생성되는 수소 이온은 미토콘드리아 막간 공간으로 이동한다. 복합체 IV에서는 전자를 최종 전자 수용체인 하나의 산소 분자로 이동시켜 산소를 두 분자의 물로 변화시킨다. 이와 동시에 미토콘드리아 안(mitochondrial matrix)에서 복합체 I, III, IV를 통해 미토콘드리아 막간 공간으로 이동한 수소 이온(H+)은 미토콘드리아 복합체 V (ATP synthase)로 이동하여 미토콘드리아 매트릭스로 다시 되돌아오면서 ATP 분자를 합성한다(Fig. 1).

Principle of mitochondrial O2 respiration under experiment. Substrates (glutamate, malate, and succinate) drive the TCA cycle and generate NADH and FADH2, respectively, which stimulates complex I and II. Electrons generated by NADH and FADH2 in complex I and II travel through the electron trans-port chain (complex I, III, and IV) and release electrons to drive ATP synthesis at complex V.
산화적 인산화에 의한 ATP 합성은 미토콘드리아의 기능을 측정하는 가장 일반적인 방법으로 알려져 있다. 이 과정은 주로 미토콘드리아의 산소(O2)호흡량 혹은 소비량 측정을 통해서 간접적으로 ATP 합성 능력을 평가하게 된다. 따라서, 긍정적 혹은 부정적으로 변화된 호흡 동역학(respiratory kinetics)은 산화적 인산화와 세포의 에너지 대사를 조절하는 긍정적 혹은 부정적 변화를 반영할 수 있다. 높은 정확도와 해상도로 미토콘드리아 산소 소비를 측정할 수 있는 장치 중 하나는 본 논문에서 소개할 고해상도 산소 측정기(high-resolution respirome-try)이다[7].
2. 미토콘드리아 호흡 항정상태(mitochondrial respiratory steady-states)의 정의
1956년 Chance & Williams [8]는 분리된 미토콘드리아(isolated mitochondria)를 이용한 실험에서 기질(substrates)을 바탕으로 호흡의 항정상태를 정의하였다(Table 1).

Terminology of respiratory steady-states
구체적으로, state 1은 외부의 기질 또는 ADP의 첨가 전 미토콘드리아 단독의 산소 소비량을 나타낸다. 미토콘드리아의 산소를 소비하기 위한 어떠한 외부의 자극이 없기 때문에, state 1은 미토콘드리아 산소 소비량이 가장 낮은 상태를 나타낸다(Fig. 2). 그 다음으로, state 2는 glutamate+malate (GM)를 추가함으로써 미토콘드리아 산소 소비량을 어느정도 증가시키는 단계다. Glutamate는 효소작용에 의해 TCA 회로에서 중요한 중간 생성물인 α-ketoglutarate를 생성하고, α-ketoglutarate 와 malate는 NADH를 생성하며, 생성된 NADH는 전자전달계로 이동하여 최종적으로 복합체 I의 활성을 유발한다. GM의 첨가는 미토콘드리아의 산소 소비량을 활성화시킬 수 있는 연료를 제공하여 미토콘드리아 기질(matrix)에서 막간으로 수소이온(H+) 이동을 활성화하여 산소 소비를 어느정도 증가시킨다(Fig. 2). State 3은 ADP가 제공된 후 발생되는 산소 소비량을 의미한다. 이 상태에서는 ADP가 ATP로 빠르게 인산화 되는 단계이기 때문에 미토콘드리아 산소 소비가 state 2보다 훨씬 많이 증가한다(Fig. 2). 실험 중에는 미토콘드리아 막의 온전함을 확인하기 위해서, cytochrome c를 주입하게 된다[9] (Fig. 2). 이때 미토콘드리아 막간공간에 존재하는 cytochrome c는 복합체 III에서 복합체 IV로 전자를 운반하는데, 실험 중 cytochrome c 주입과 동시에 산소 소비량이 증가하면, 미토콘드리아의 외막이 손상되었다는 것을 의미한다. 다음 단계는 oligomycin을 주입함으로써, state 4 상태를 만든다. Oligomycin은 미토콘드리아 전자전달계 내에 복합체 V (ATP Synthase)를 억제함으로써 미토콘드리아의 산소 소비량을 급격한 속도로 낮춘다[10,11] (Fig. 2). State 4는 모든 ADP가 ATP로 인산화 되고 남아있는 산소 소비량을 의미한다(Fig. 2). FCCP (Carbonyl cyanide-4-(trifluoromethoxy)phenylhy-drazone)는 미토콘드리아의 산화적 인산화를 방해하는 강력한 uncou-pler이다. 이 FCCP는 미토콘드리아의 막간공간에 있는 수소이온에 대해 미토콘드리아 내부로의 투과성을 증가시킨다. 이로 인해 미토콘드리아의 산소 소비가 급격하게 증가하게 된다[12,13] (Fig. 2). 마지막으로 state 5 상태는 모든 실험이 종료된 후 산소가 고갈된 상태를 의미한다.
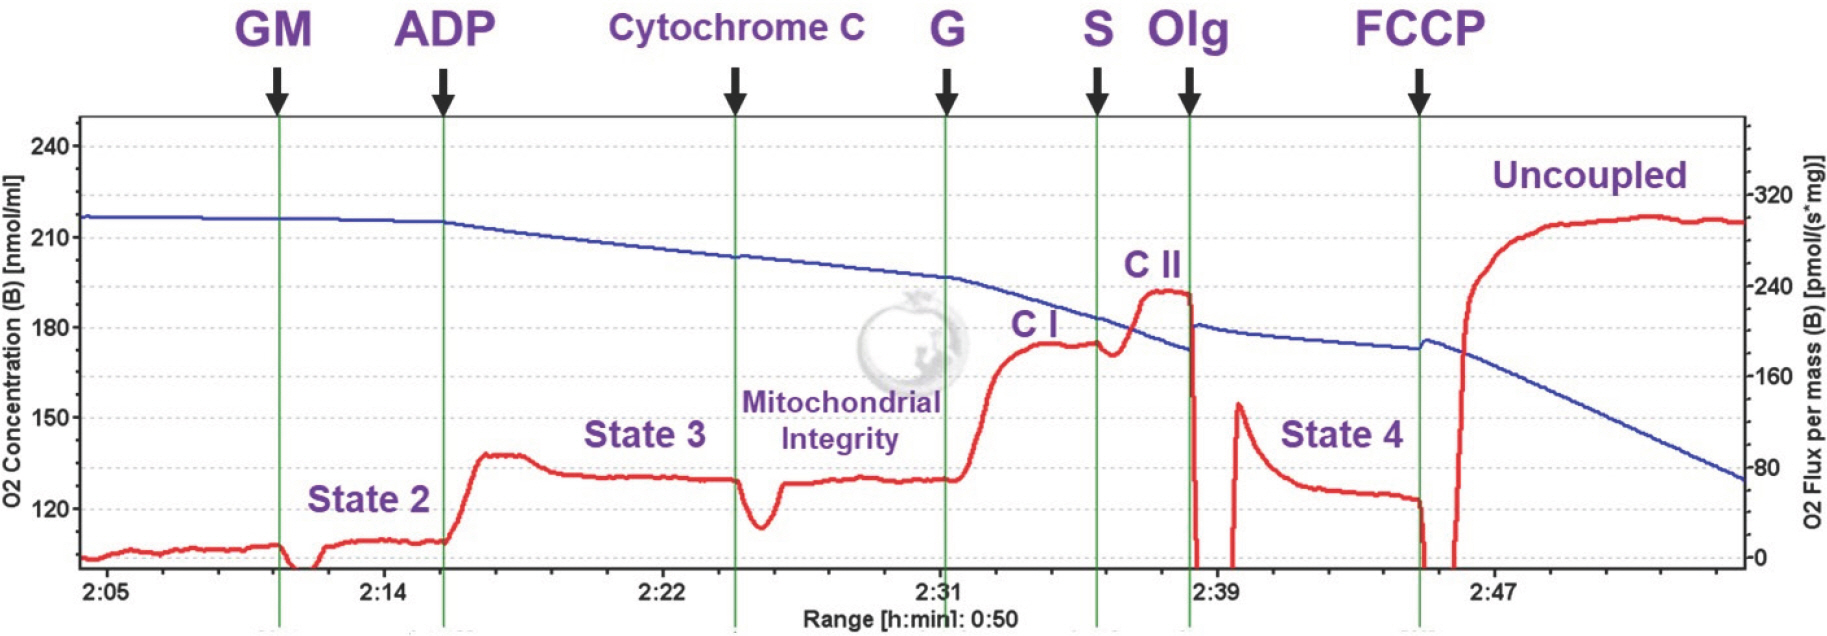
Definition of respiratory steady-states. State 1, mitochondria alone; State 2, substrates (glutamate+malate) added, low O2 consumption; State 3, ADP added, high O2 consumption; State 4, all ADP converted to ATP, low O2 consumption. Substrate and coupling states (Purple) are shown by horizontal axis. Blue curve represents O2 concentration in O2k chamber and oxygen fluxes per tissue mass are displayed (red curve) simultaneously. GM, glutamate+malate; ADP, adenosine diphosphate; G, glutamate; S, succinate; Olg, oligomycin; FCCP, Carbonyl cyanide-4-(trifluoromethoxy)phenylhydrazone; CI, complex I; CII, complex II.
미토콘드리아의 산소 소비량을 평가할 때는 일반적으로 state 2, 3, 혹은 4 상태를 주로 평가하게 된다. 이렇게 단계별로 평가하는 것도 중요하지만, respiratory control ratio (RCR)를 평가하는 것 또한 미토콘드리아 산소 소비량을 평가하는 중요한 방법 중 하나이다. RCR은 state 3 상태를 state 4 혹은 2 상태(실험 하에서 state 2와 4는 같은 개념으로 본다)로 나눈 값으로, ADP에서 ATP로의 인산화에 대한 산소 소비량을 나타낸다(Fig. 3). 즉, RCR 값이 높다는 것은 ATP를 생성해내는 효율이 좋다는 것을 의미한다.
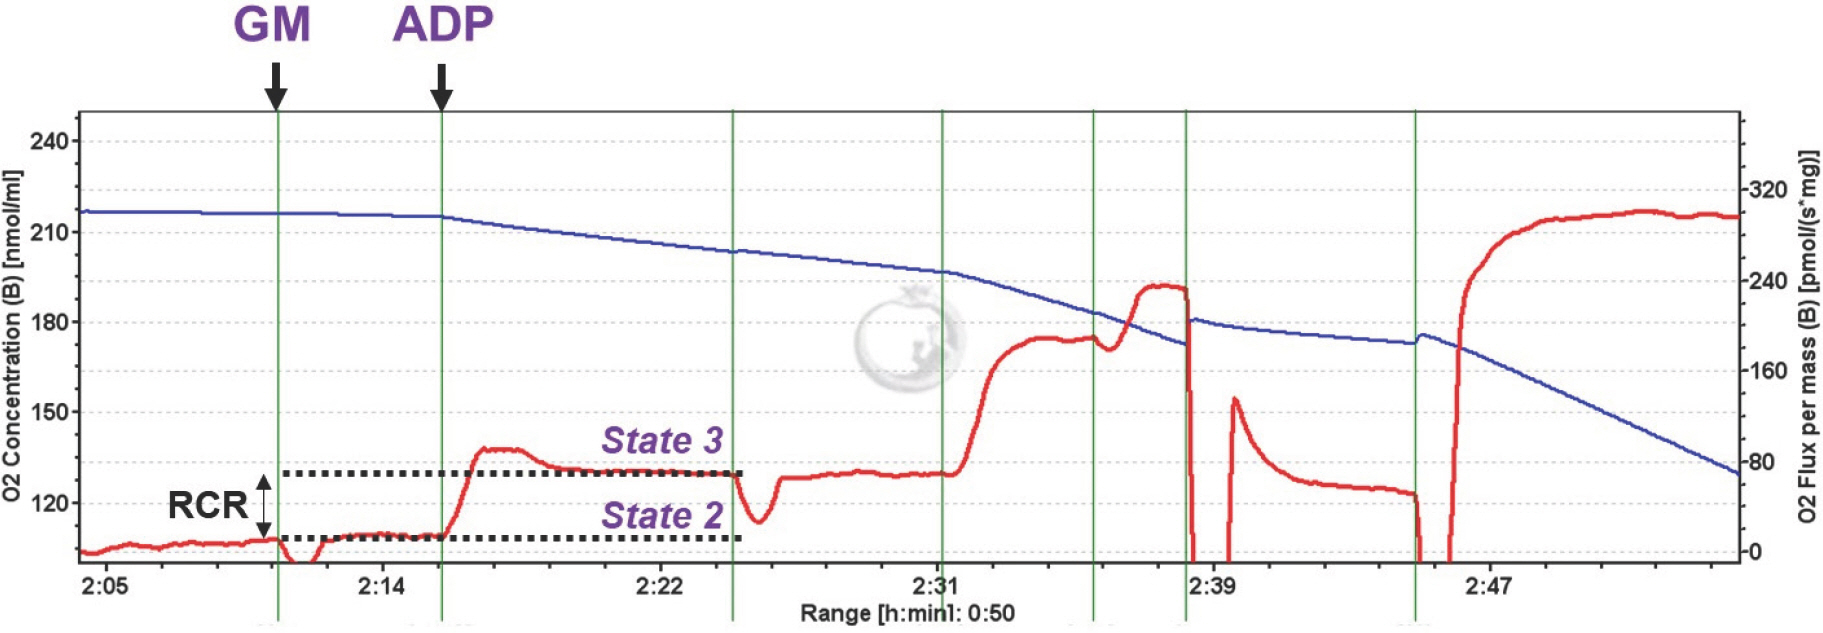
Definition of respiratory control ratio (RCR). RCR is determined by the rate of oxygen consumption while ADP is being phosphorylated (state 3) di-vided by the lower rate of ADP (state 2 or 4).
본 논문에서는 고해상도 산소 측정기(High-resolution respirometry)를 이용하여 미토콘드리아의 산소 소비량을 다음과 같은 순서의 실험방법을 통해 설명된다. i) 5 mM glutamate+2 mM malate supported consumption (state 2, electron entry via complex I), ii) maximal 4 mM ADP-supported O2 respiratory capacity (state 3), iii) 10 μM cytochrome c for mitochondrial integrity, iv) 10 mM succinate-stimulated respiration (state 3, electron entry via complex II), v) 10 μg/mL oligomycin (inhibition of complex V, state 4), and vi) 2 μM FCCP (uncoupler of oxidative phosphorylation).
실험 절차
1. 버퍼(Buffer) 만드는 방법
미토콘드리아 기능을 측정하기 위해서는 기본적으로 Buffer X와 Z, 총 2가지 Buffer가 필요하다. Buffer X와 Z 구성성분은 표 2와 표 3과 같다(Tables 2 and 3).
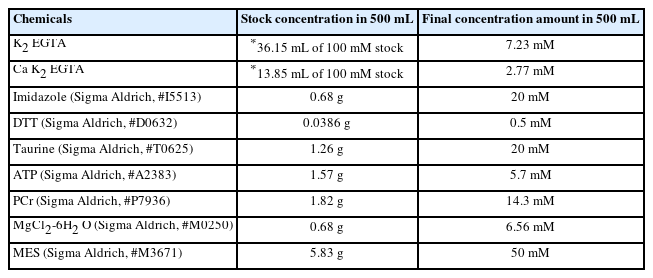
Chemicals for Buffer X (500 mL, pH 7.1)
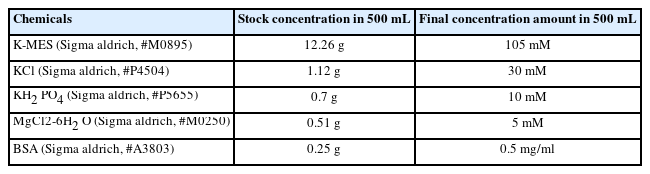
Chemicals for Buffer Z (500 mL, pH 7.1)
Buffer X와 Z를 통해서 실험에 직접 사용되는 assay buffer (50 mL buffer Z+1 mM EGTA+20 mM creatine hydrate, Table 4)를 만들고, 실험 전 조직의 준비단계에서 필요한 washing buffer (50 mL buffer Z+1 mM EGTA, Table 5)와 Permeabilization buffer (1.5 mL buffer X+50 μL/mg stock saponin)를 만든다. Note: Permeabilization buffer를 만드는 방법은 다음과 같다. Saponin (Sigma Aldrich, #S4521)을 먼저 10 mg/1 mL H2 O 농도로 stock saponin을 만든다. 그 이후에 미리 Buffer X를 1.5 mL씩 분주해 놓은 tube에 saponin stock을 50 μL/mg 농도가 되도록 넣는다.
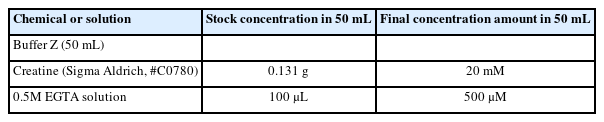
How to prepare assay buffer
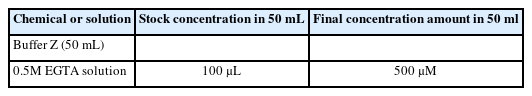
How to prepare washing buffer
2. 조직 준비과정
조직을 이용하여 미토콘드리아 기능을 측정하는 방법에는 (a) permeabilized tissues와 (b) homogenized tissues 방법이 있다. 실험방법은 조직에 따라 결정되는데, 골격근 혹은 심장근과 같이 조직이 단단한 경우에는 permeabilization 방법을 사용해야 하고, 반대로 뇌, 간, 폐, 비장 등과 같이 상대적으로 부드러운 조직은 homogenization 방법을 사용해서 실험을 진행해야 한다. Permeabilization 방법과 homogenization 방법은 각각 미토콘드리아 기능을 측정하기 전 준비과정에 차이가 있다.
1) Permeabilized tissue protocol
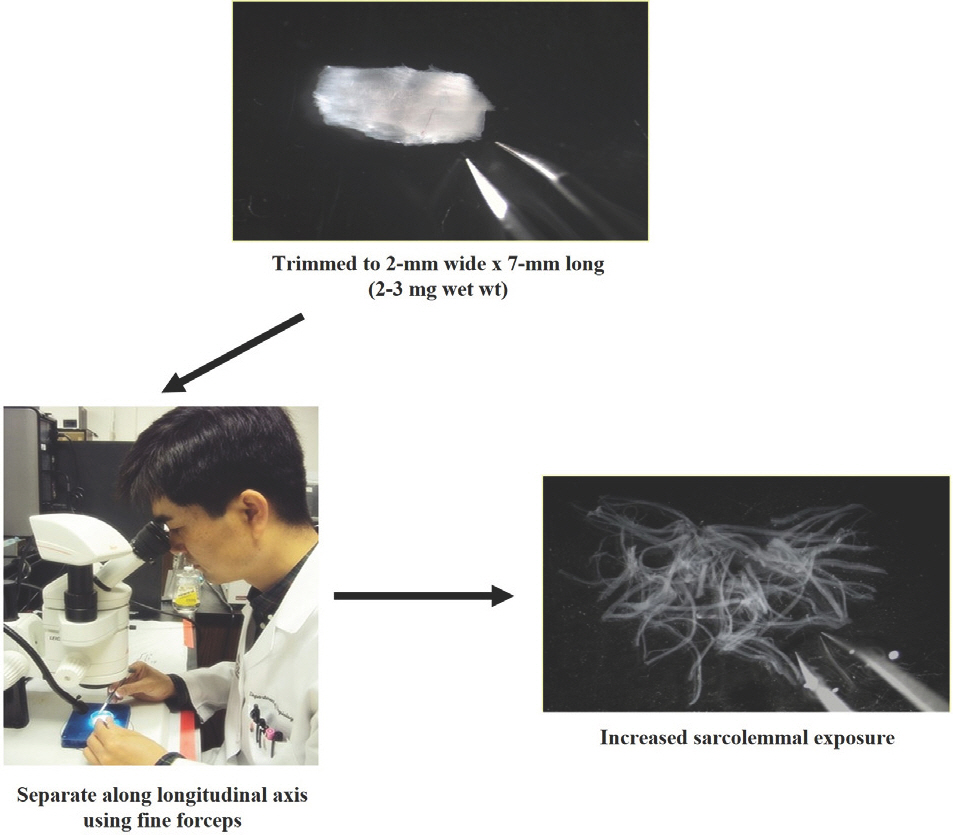
Permeabilized tissue 방법을 사용한다면, 미토콘드리아 기능을 측정하기 전 다음과 같이 크게 3가지 단계로 구분한다. a) Separation, b) Permeabilization, c) Washing (Fig. 4). 실험의 절차는 다음과 같다.
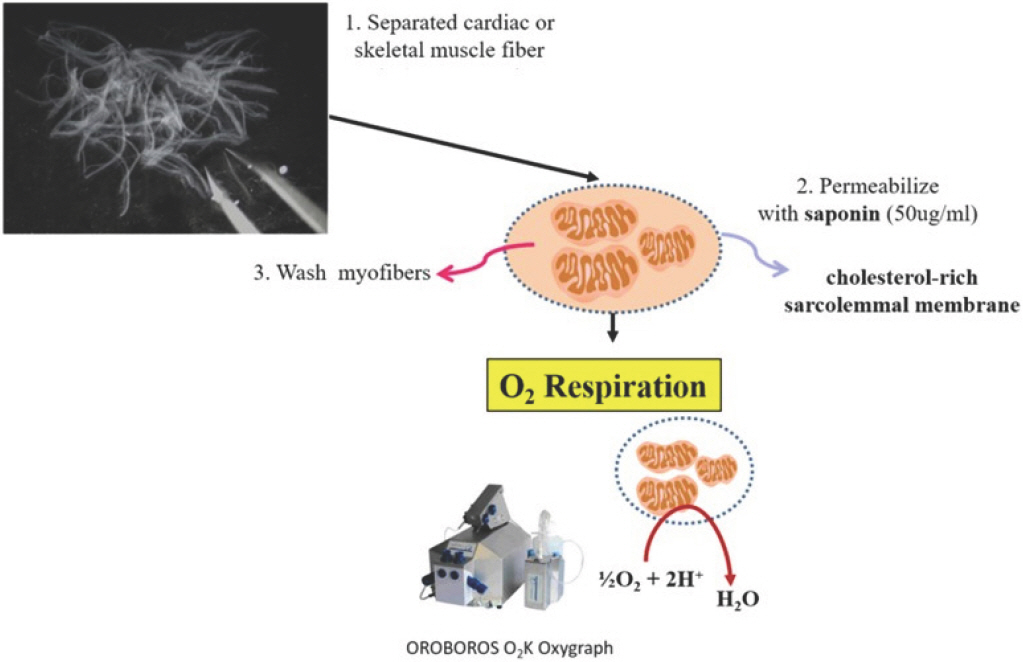
Procedures for mitochondrial O2 respiration in permeabilized tissues. (1) Separate cardiac or skeletal muscle fiber using micro-forceps. (2) Permeabilize muscle fiber with saponin (50 μg/mL). (3) Wash myofibers using washing buffer to remove endogenous substrates. (4) Measure mitochondrial oxygen respiration using OROBOROS O2K oxygraph.
(1) 근육 혹은 심장 조직의 원하는 부위를 해부한 후 2-3 mg 정도 적출해낸다. 나머지 조직은 원하는 실험방법에 맞춰서 보관한다.
-
(2) Separation: 떼어낸 조직을 Buffer X가 담겨있는 small petri dish (SPL life sciences, #11035)에 놓고 해부 현미경과 micro-forceps를 이용하여 근 섬유를 잘게 분리한다(Fig. 5).
Note: Separation 작업은 항상 ice 위에서 진행해야 한다.
-
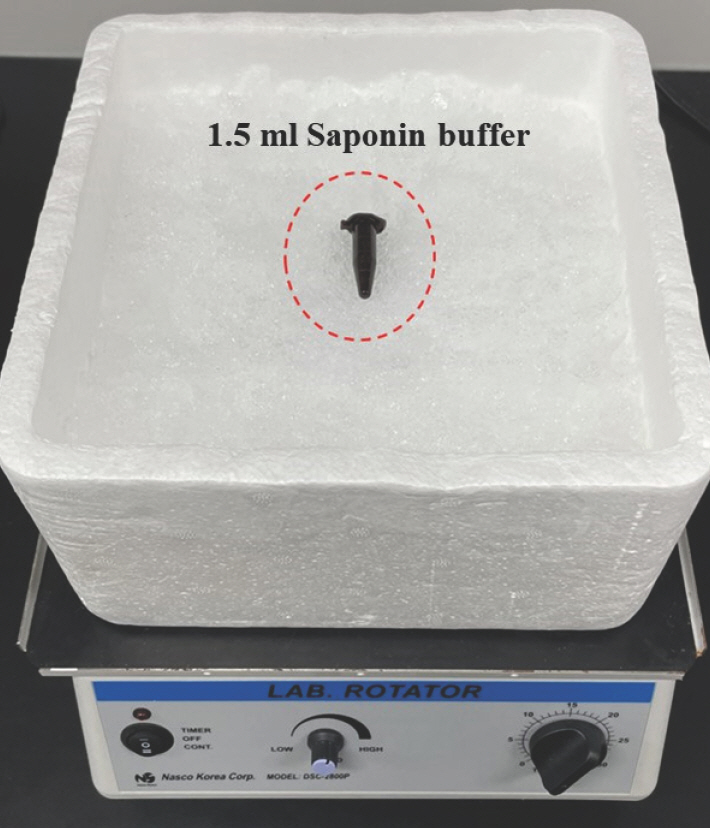
(3) Permeabilization: (2)에서 분리된 근 섬유를 앞서 미리 만들어 놓은 permeabilization buffer가 담긴 tube에 옮겨 놓고 얼음 위에서 30분동안 permeabilization을 위하여 shacking 해준다(Fig. 6).
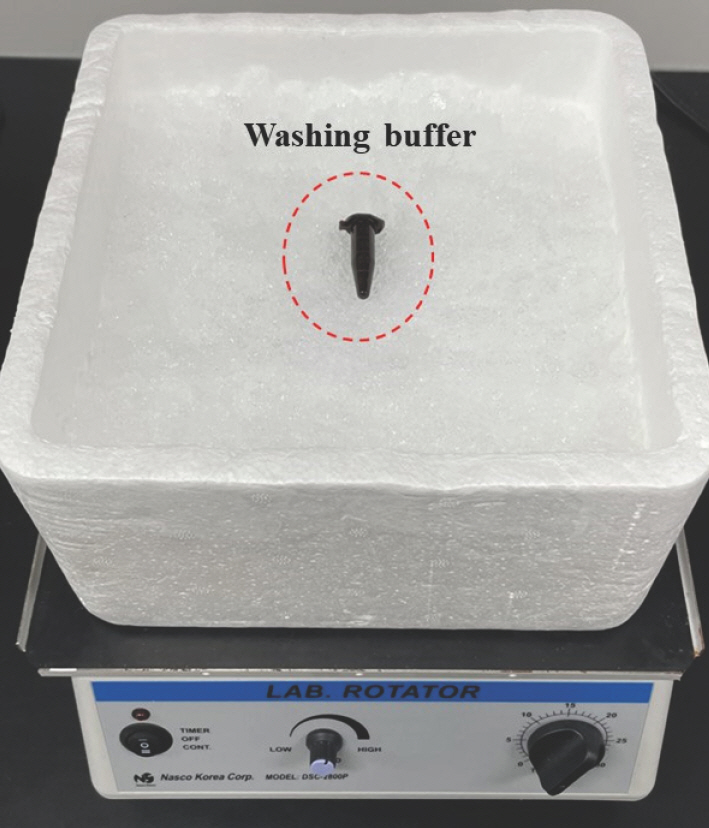
(4) Washing: 30분이 지나면, permeabilization buffer 안에 있는 조직을 꺼내고, 미리 준비해 놓은 washing buffer가 담긴 tube에 옮겨 놓고 얼음 위에서 조직 내 내부 기질(endogenous substrates)을 제거하기 위해 shacking 해준다. Washing은 최소 15분 동안 진행해준다(Fig. 7).
2) Homogenized tissues protocol
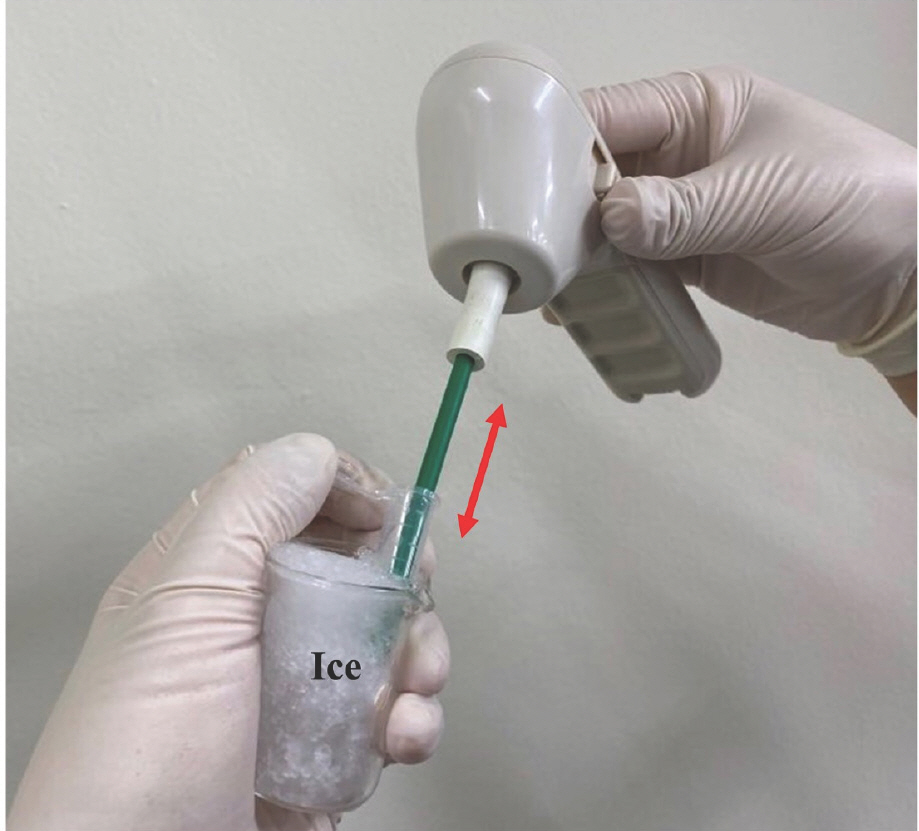
앞서 언급한 것과 같이, 뇌, 간, 폐, 비장 등과 같은 부드러운 조직은 permeabilization 방법을 할 수 없기 때문에 homogenization 방법을 이용해서 실험을 진행한다. Homogenization 방법은 permeabilization 방법에서 실시하는 3가지 준비과정(separation, permeabilization, washing)을 거치지 않고, 조직을 tissue grinder를 이용해서 바로 갈고 측정에 들어간다(Fig. 8). 준비절차는 다음과 같다.
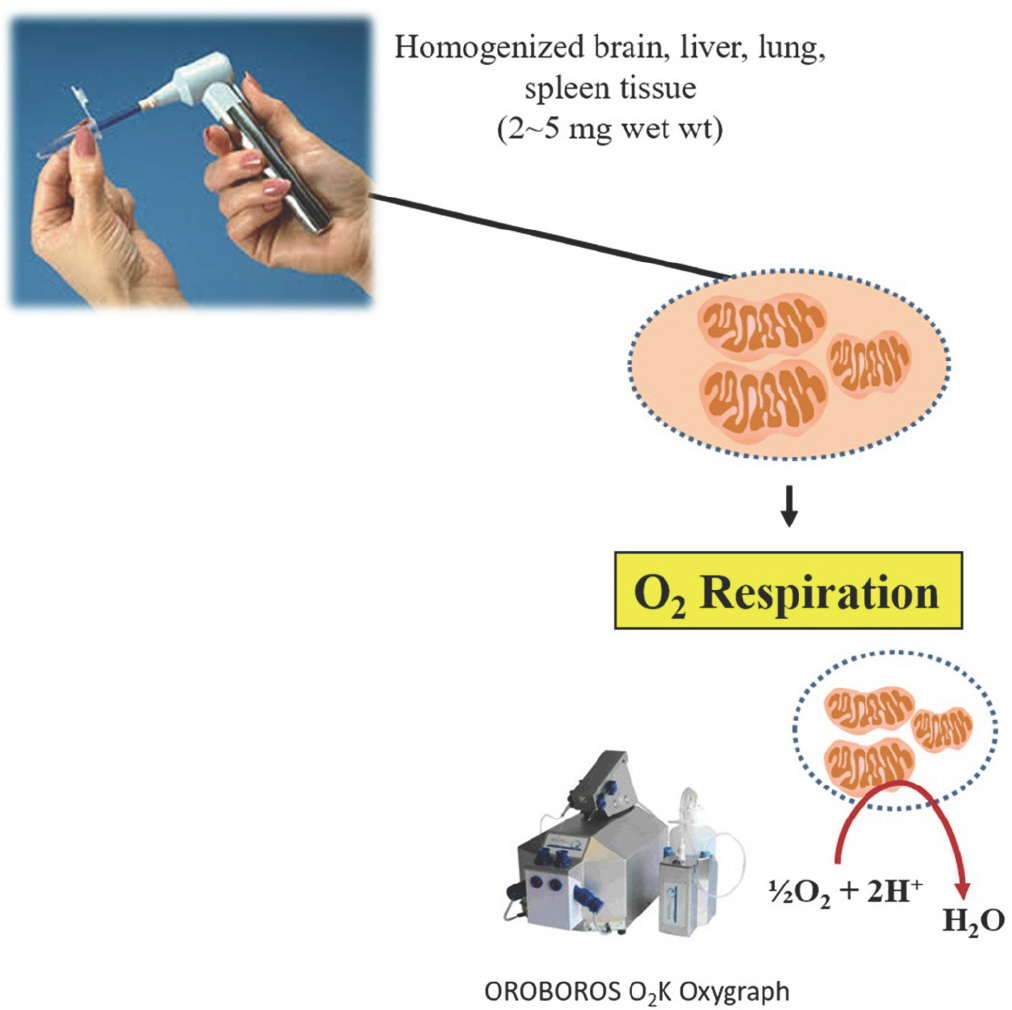
Procedures for mitochondrial O2 respiration in homogenized tissues. (1) Homogenize approximately 2-5 mg of brain, liver, lung, and spleen tissues in 200 μL of assay buffer. (2) Measure mitochondrial oxygen consumption using OROBOROS O2K Oxygraph.
-
(1) 측정하고자 하는 조직 2-5 mg을 assay buffer 200 μL를 미리 담아 놓은 1.5 mL tube에 넣고 Tissue Grinder Motor and Pestles (Bel-Art, CUBA. 19922-0005)를 통해서 50회 동안 위아래로 조직을 갈아준다(Fig. 9).
Note: 모든 sample을 일정한 횟수로 갈아주는 것이 중요하다.
3. 측정 방법
앞서 permeabilized 혹은 homogenized 방법을 통해 조직이 준비가 되었다면 OROBOROS O2K Oxygraph를 이용하여 미토콘드리아의 산소 소비량을 측정한다.
1) Permeabilized tissue
Buffer Z를 이용하여 만든 assay buffer를 O2K chamber 안에 2.1 mL 을 넣어준다. 그 후 앞서 separation, permeabilization 및 washing 과정이 끝난 permeabilized tissue를 chamber에 투입한다.
2) Homogenized tissue
Buffer Z를 이용하여 만든 assay buffer를 O2K chamber 안에 950 μL 를 먼저 넣어준다. 그 후, homogenized tissue가 들어있는 tube에서 200 μL를 전부 넣어준 후, assay buffer 950 μL를 tube에 넣어주고 위아래로 pipetting을 통해 tube 벽면에 묻은 모든 tissue를 회수하여 chamber에 넣어준다(chamber 내 total assay buffer 양은 2.1 mL).
각 chamber 내에 tissue를 넣어준 후 다음과 같은 프로토콜을 이용하여 미토콘드리아의 산소 소비량을 측정한다(미토콘드리아의 complex substrate 별 state 2, state 3, 그리고 state 4 측정); 프로토콜–i) 5 mM glutamate+2 mM malate supported consumption (state 2, electron entry via complex I), ii) maximal 4 mM ADP-supported O2 respiratory capacity (state 3), iii) 10 μM cytochrome c for mitochondrial integrity, iv) 10 mM succinate-stimulated respiration (state 3, electron entry via complex II), v) 10 μg/mL oligomycin (inhibition of complex V, state 4), and vi) 2 μM FCCP (uncoupler of oxidative phosphorylation).
결 론
본 논문에서 설명하는 조직을 이용한 미토콘드리아의 산소 소비량 측정법은 미토콘드리아를 손상시키지 않고, 살아있는 상태에서 측정하여 신뢰할 수 있는 실험방법 중 하나이다. 최근 다양한 질병들이 미토콘드리아의 기능과 연관성이 있다는 연구들이 급격하게 증가함에 따라, 미토콘드리아의 기능을 측정하고자 하는 연구자들의 관심도도 함께 증가하고 있는 추세이다. Permeabilized/homogenized tissue를 이용한 측정방법은 기존에 사용하던 실험방법(isolated mitochondria)보다 1) 시간과 조직의 양을 최소화하고, 2) 미토콘드리아를 살아있는 상태에서 측정하며, 3) 미토콘드리아의 구조와 기능에 상대적으로 적은 상해를 준다는 측면에서 본 논문의 실험방법은 매우 효과적이고 앞으로 전 세계적으로 점진적으로 활용도가 증가될 것으로 기대된다.
Notes
이 논문 작성에 있어서 어떠한 기관으로부터 재정을 포함한 일체의 지원을 받지 않았으며, 논문에 영향을 미칠 수 있는 어떠한 관계도 없음을 밝힌다.
AUTHOR CONTRIBUTIONS
Conceptualization: JW Heo, EJ Cho; Data curation: J Han, DH Park, JH Kang; Formal analysis: JW Heo, EJ Cho, HB Kwak; Funding acquisition: HB Kwak; Methodology: JW Heo, EJ Cho, Y Choi, DY Seo; Project administration: HB Kwak; Visualization: JW Heo, EJ Cho; Writing - orig-inal draft: JW Heo, EJ Cho; Writing-review & editing: EJ Cho, HB Kwak.