Determination of Anaerobic Capacity - Reliability and Validity of Sprint Running Tests
Article information

Trans Abstract
PURPOSE
A number of physiological diagnostics were developed. However, the timeline-related diagnostics of maximal anaerobic glycolytic capacity remain unclear. The objective of this study was to evaluate the reliability and validity of a sprint running test to assess the anaerobic capacity.
METHODS
The study was divided into three parts. Sixty-one male (24±4 years, 181.0±4.3 cm; 78.5±5.9 kg) and twelve female (25±3 years, 167.0±0.6 cm, 60.4±5.7 kg) sports students participated in this study. Twenty-five subjects (13 males, 24±2 years, 181.0±0.5 cm, 78.5±5.9 kg; 12 females, 25±3 years, 167.0±0.6 cm, 60.4±5.7 kg) performed incremental step tests at running track and several linear sprints on a running track (LSRT) with different time durations (8, 10, 12, and 14 seconds)(part I) on different days. Twenty-five male subjects (24±3 years, 180.7±6.7 cm, 84.6±8.8 kg) conducted a 10 or 12 second sprint running on a non-motorized treadmill (NMT)(part II). In part III, twenty-three male subjects (24±2 years, 181.4±5.8 cm, 74.5±7.4 kg) ran a 10 second LSRT and NMT on consecutive days. Capillary blood samplings were taken before (Lacr) and after the sprint running for ten minutes at one minute intervals to find out maximal lactate concentration after exercise and to calculate the maximum lactate production rate (LPRmax).
RESULTS
For all parts reliability for LPRmax was proven (Part I: 8 seconds: ICC: r=.89; 10 seconds: ICC: r=.82; 12 seconds: ICC: r=.92; 14 seconds: r=.84, respectively; Part II: 10 seconds: ICC: r=.76; 12 seconds: ICC: r=.79). To analyze validity for LPRmax, Part III was conducted and proven valid (ICC: r=.96, p=.074).
CONCLUSIONS
We demonstrate that LSRT and NMT reliably determine anaerobic capacity and can be used as a valid tool for physiological performance diagnostics.
INTRODUCTION
Several physiological diagnostics have been used to ascertain individual performance capability in professional sports. Aerobic power can be determined by maximal oxygen uptake (VO2max), while aerobic performance can also be measured by metabolic parameter, indirectly by heart rate and lactate samples [1,2]. While the aerobic metabolism system is primarily of importance especially in the case of long-term loads, the anaerobic metabolism plays a major role for shorter times of performance [3]. Incremental test protocols on running tracks, treadmills and ergometers (cycling, rowing, and arm crank, respectively) are well established in professional sports for this purpose [4-6]. In contrast, protocols to determine anaerobic glycolytic capacity remain unclear. Even if a sprint test designed for cycling based on findings by Mader et al. [7], which has been used limited in the field [4]. According to existing sprint tests, the combined use of biomechanical as well as physiological variables does not implicate maximal lactate accumulation [5,8,9]. Additionally, other tests for cycling and running to assess sprint performance (i.e., reaction time at start, time of sprint run or run selections) were reported, but it is also a lack of data for glycolytic capacity [5,6,9-12]. Margaria et al. [13] introduced a “stair-test” to determine the alactic capacity in athletes involved in running sports. Power was assessed in Watt by measured vertical speed in respect to athlete’s weight [3,13]. Other running test protocols are developed for the treadmill. Lakomy [14] and McLain et al. [15] used high intensity sprint running on a non-motorized treadmill to assess sprint performance. In this protocol, a force transducer was used to measure power output. Although this test has been used by other researchers [16], it does not assess physiological parameters.
The anaerobic capacity is divided in alactic and lactic pathways. The anaerobic alactic high energy phosphate system can only be used for a few maximal muscle contractions as glucose will be spent by lactic acid accumulation before all phosphates are consumed [3,17,18]. Besides ATP concentration, creatine phosphate, glycogen store, and enzyme activity, anaerobic energy supply depends on quantity and quality of fast-twitch filaments [19,20].
The parameter for the maximal glycolytic capacity is the maximum lactate concentration during specified time (maximum lactate production rate = LPRmax) [7]. Supramaximal sprints, including analysis of time, power values and blood lactate prior and after sprinting, are used to assess the maximal flow rate of glycolysis [3,4,6,21]. Heck et al. [3] suggested, a sprint test should last about 10 seconds. A longer time duration (40-60s) results in a lower power, increased hydrogen ion concentration and decreased phosphofructokinase activity.
In fact, performance diagnostics are conducted in field and/or in laboratory. Also, the test of anaerobic glycolytic capacity can be organized in a track, field sports hall and on a non-motorized treadmill. The aim of this study was to examine the reliability and validity of sprint running test designs to determine the anaerobic capacity by using the rate of maximal lactate production. For this purpose, the reliability for linear sprint on a running track (part I) and a non-motorized treadmill (part II) were tested. Part III was conducted to examine the comparability of both test designs used in part I and II. Consequently, this study uses specific sprint time durations of 8, 10, 12, and 14 seconds to expose the influence of different time durations on LPRmax.
METHODS
1. Participants
All participants were sports students taking part in undergraduate bachelor studies at German Sport University Cologne (61 male, 24±4 years, 181.0±4.3 cm; 78.5±5.9 kg; 12 female, 25±3 years, 167.0±0.6 cm, 60.4±5.7 kg).
In case of part I, all data were collected from twenty-five male and female sports students (13 males, 24±2 years, 181.0±0.5 cm, 78.5±5.9 kg; 12 females, 25±3 years, 167.0±0.6 cm, 60.4±5.7 kg). They performed three sprints per day for eight days over one of four time periods (8s, 10s, 12s and 14s, respectively). The time period selected on day one was repeated on day two and the time period selected on day three, repeated on day four. This pattern was duplicated for all four time periods and the order in which they were undertaken was randomised.
In part II, twenty-five male sports students (24±3 years, 180.7±6.7 cm, 84.6±8.8 kg) performed one sprint over either 10 or 12 seconds on consecutive days using a non-motorized treadmill (NMT).
In part III, twenty-three male sports students (24±2 years, 181.4±5.8 cm, 74.5±7.4 kg) performed one 10 second linear sprints on a running track (LSRT) and NMT on consecutive days (Fig. 1A).
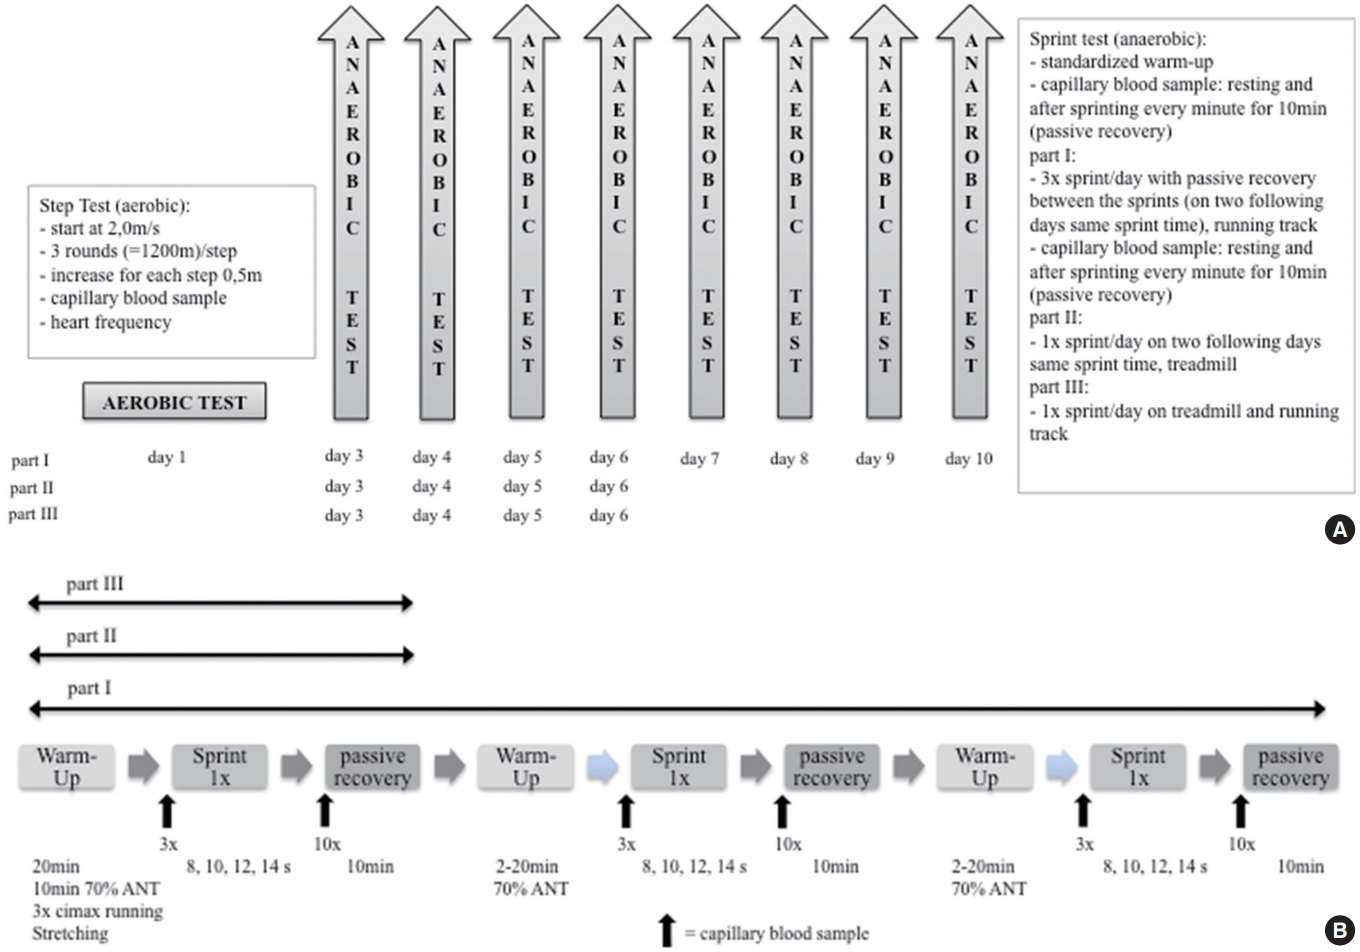
(A) Study design. (B) Test design for anaerobic measurement.
Subjects were informed about the benefits and potential risks of the tests. None of the participants reported any current or ongoing diseases or injuries and none were taking medications, drugs or any dietary supplements known to influence physical performance. Dietary intake and physical activity were reported on a daily basis for the duration of the study to minimize possible impacts on performance.
The study was approved by the ethics committee of the German Sport University Cologne (No. 140/2017). The applied protocols align with the Declaration of Helsinki. All participants signed an informed consent form.
2. Lactate threshold test on running track
All subjects ran an incremental step test on running track to determine individual 4 mmol·L-1 threshold (4 mmol·L-1 T). The test began at 2.0 m · s-1 and increased by an increment of 0.5 m · s-1 at 1,200 meter intervals until participants reached a speed of 4.5 m· s-1 [7,22], upon which the increments were increased at 1,600 meters interval. Upon completion of the test athletes ran 800 meters for active recovery. Capillary blood was sampled from the earlobe to determine lactate levels prior to running and immediately after each step. Heart rate was recorded via a sensor (Polar Electro GmbH, Büttelborn, Germany). The 4 mmol·L-1 T was used to design a standardized warm-up. For all parts of the blood lactate concentration was analysed by an enzymatic-amperometric sensor chip system (Biosen S-line, EKF-diagnostic GmbH, Barleben, Germany) (Fig. 1B).
3. Anaerobic Sprint Running Test
To minimize the surrounding effects such as weather and wind, the field running tests were located inside a track and field sports hall. The laboratory sprint running took place on a NMT.
Before sprint running, subjects conducted a standardized warm-up: ten minutes moderate running (70% at 4 mmol ·L-1 T), an individual stretching-program, and three increased speed ending at an intensity of 80-90% of sprint running. After warm-up, capillary blood was taken from the earlobe to determine resting lactate level. To minimize effects of warm-up on maximal lactate level after exercise, the resting level had to be low (≤ 2.0 mmol·L-1). It is common knowledge that a negative correlation exists between lactate concentration and PCr concentration as well as VO2max at the end of physical activity. As a result, it was imperative to create the lightest possible warm up. After analyzing the first sample, another sample was taken immediately before sprint running. After sprint running, the subjects were seated immediately for ten minutes and blood samples taken at one minute intervals. The seated resting position was required in order to prevent any lactate from being decreased by physical movement and its energy metabolism (Fig. 1B).
Rate of lactate production was determined according to Mader et al. [7] equation:
Equation 1
Lacmax= maximal lactate concentration after exercise
Lacr= resting lactate
Et= time of exercise
alact= alactic time
The alactic time is defined by the time from start until power peak [3]. The following equation was used to calculate the power curve on the treadmill:
Equation 2
P= Powermax= maximal power
F = force
v =velocity
This equation excludes any vertical forces in the calculation as these forces similarly affect athletes at every point of time (gravity: 9.81-2 m·s-2).
For LSRT the calculation differs due to the fact that power cannot be estimated.
Equation 3
P= power
m = mass
d = distance
t= time
4. Part I
The subjects performed the sprint run on running track inside a sports hall. After the described warm-up, they performed three sprint running. The time of sprints were either eight, ten, twelve or fourteen seconds. Any time period was run on two following days, three times respectively. The sprints were traced by laser measurement (LMCJ-300-18 Sport, Kempf GmbH, Walldorf, Germany). The period of time between the sprints was determined by lactate level of subjects. This level had to be ≤ 2.0 mmol·L-1. The participants ran moderately to eliminate lactate after sprint running, after the ten minutes for taking blood samples were over. The time of running varied between 2-20 minutes, depending on time of sprint running.
5. Part II
Before testing day, all participants familiarized themselves with running on a NMT (WOODWAY Pro XL Series, Woodway GmbH, Well am Rhein, Germany). Subjects performed a warm-up and the sprint trial on the treadmill. The time of sprint lasted ten or twelve seconds and they performed the same selected sprint running on two consecutive days. The treadmill had to be driven by the subject’s internal force. Therefore, the participant was attached via a belt and straps on a fixed holding. A force transducer was positioned between straps and fixed holding to measure the subject’s horizontal force. Individual power was determined using a force and velocity plot.
6. Part III
All subjects completed a sprint running on the track as well as a NMT on two consecutive days. The time of sprint was ten seconds. Before each sprint, the subjects performed a standardized warm-up and provided the opportunity to familiarize themselves with running on a NMT (Fig. 1A).
7. Statistical analyses
Descriptive statistics were calculated using Microsoft Excel 2013 (Microsoft, Redmond, WA, USA). The data are presented as means±standard deviation (SD). The statistical analyses were performed using SPSS software version 21 (SPSS, Chicago, IL, USA).
The normal distribution of the data was performed by the ShapiroWilk test. Data for part I and II were not normally distributed contrary to part III. Thus, Friedman repeated-measures rank test with post-hoc Wilcoxon test was applied for Part I. During part II and III, Wilcoxon test and dependent t-test were used to examine the difference between day-to-day (part II) and running track testing versus laboratory sprint test. The relationships between the variables were determined by calculating intra-class correlation test (ICC; two-way fixed model, consistency option, single score), confidence interval (95% CI) and coefficient of variation (CV %).
RESULTS
1. Part I: Sprints on running track inside a sports hall (8 seconds, 10 seconds, 12 seconds, and 14 seconds)
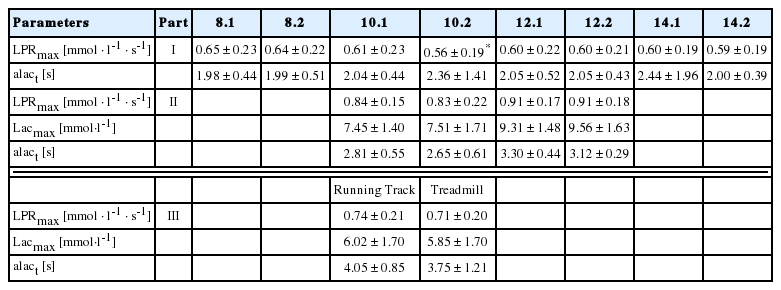
The maximum lactate production rate of several sprint times indicated high reliability (LPRmax 8 seconds of 2 days: ICC: r=.89, CI = 0.78-0.95, CV= 9.8%; 10 seconds of 2 days: ICC: r=.82, CI = 0.63-0.92, CV=12.9%; 12 seconds of 2 days: ICC: r=.92, CI = 0.82-0.96, CV= 9.0%; 14 seconds of 2 days: r=.84, CI = 0.67-0.93, CV=10.7%, respectively) (Fig. 2A). The alactic time of several sprint times showed high reliability only during 8 seconds and 12 seconds (alact 8 seconds of 2 days: ICC: r=.73, CI = 0.48-0.87, CV=11.1%; 10 seconds of 2 days: ICC: r=.16, CI = -0.24-0.52, CV=10.1%; 12 seconds of 2 days: ICC: r=.76, CI = 0.53-0.89, CV= 8.7%; 14 seconds of 2 days: ICC: r=.11, CI = -0.29-0.48, CV=10%, respectively) (Fig. 2B). Friedman repeated-measures rank test with post-hoc Wilcoxon test showed only a significant difference of LPRmax during 10 seconds between 2 day measurements (p=.048). Furthermore, no significant difference of alact between different sprint times was found (Table 1).

(A) Correlation of the part I using the ICC (intra-class correlation) test in LPRmax, maximal lactate rate of different measurement times (8 seconds, 10 seconds, 12 seconds, and 14 seconds of 2 measurements). (B) Correlation of the part I using the ICC test in alact, alactic time of different measurement times (8 seconds, 10 seconds, 12 seconds, and 14 seconds).
Comparison of part I, II, and III in several measurement times (8s, 10s, 12s, and 14s) and different measurements (running track vs. treadmill)
2. Part II: Sprint running on a treadmill (10 seconds and 12 seconds)
During 10 seconds sprint running between 2 measurements, significant correlations of LPRmax, Lacmax, alact were found (ICC: r=.76, CI = 0.38-0.92, CV=7.6%; ICC: r=.91, CI = 0.73-0.97, CV=5.2%; ICC: r=.47, CI = -0.80-0.80, CV=10.2%, respectively)(Fig. 3A). Besides alact of 12 seconds sprint running (ICC: r=.26, CI = -0.40-0.75, CV=7.8%, respectively), other parameters showed significant reliabilities (LPRmax: ICC: r=.79, CI = 0.35-0.94, CV= 6.1%; Lacmax: ICC: r=.77, CI = 0.32-0.94, CV=5.8%)(Fig. 3B). Wilcoxon test of all parameters during 10 seconds and 12 seconds sprint running showed no significance (Table 1).
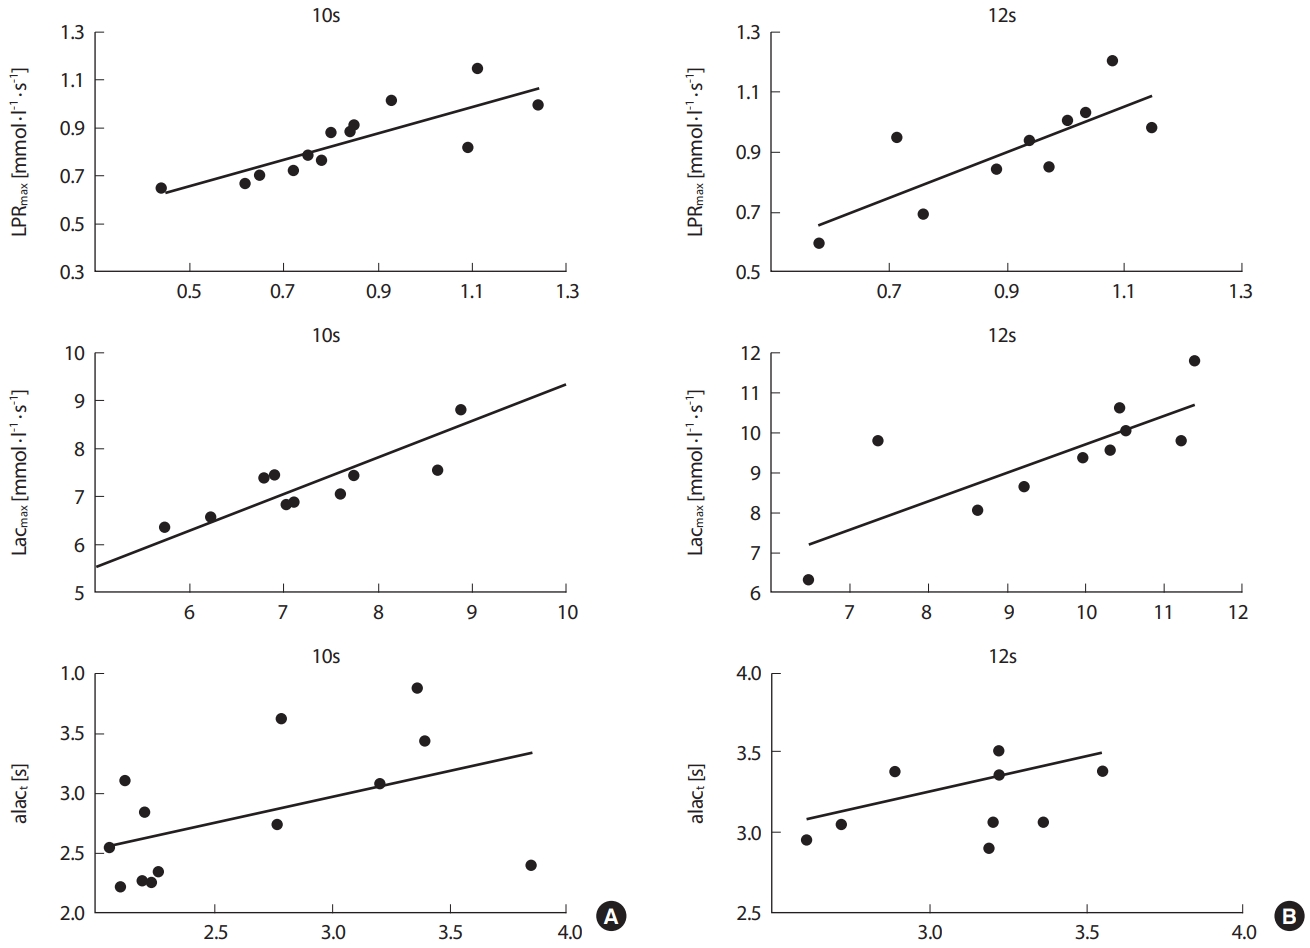
(A) Correlation of the part II using the ICC test (intra-class correlation) in LPRmax: maximal lactate rate, Lacmax: maximum lactate and alact: alactic time of 10 seconds sprint time between 2 measurements. (B) Correlation of the part II using the ICC test in LPRmax, maximal lactate rate; Lacmax, maximal lactate and alact, alactic time of 12 seconds sprint time between 2 measurements.
3. Part III: Comparison between running track and treadmill
For LPRmax, Bland-Altman plots showed a significant correlation between running track and treadmill (ICC: r=.96, CI = 0.91-0.98, CV= 4.6%) (Fig. 4A). Furthermore, a significant correlation of Lacmax on different measurements was found (ICC: r=.91, CI = 0.79-0.96, CV= 8.3%)(Fig. 4B). Other parameter such as alact was minimally correlated (ICC: r=.75, CI = -0.43-0.89, CV=15.5%)(Fig. 4C). The Wilcoxon test showed no significant difference for LPRmax and alact. Furthermore, the paired t-test indicates no significance for Lacmax2020-06-23 (Table 1).
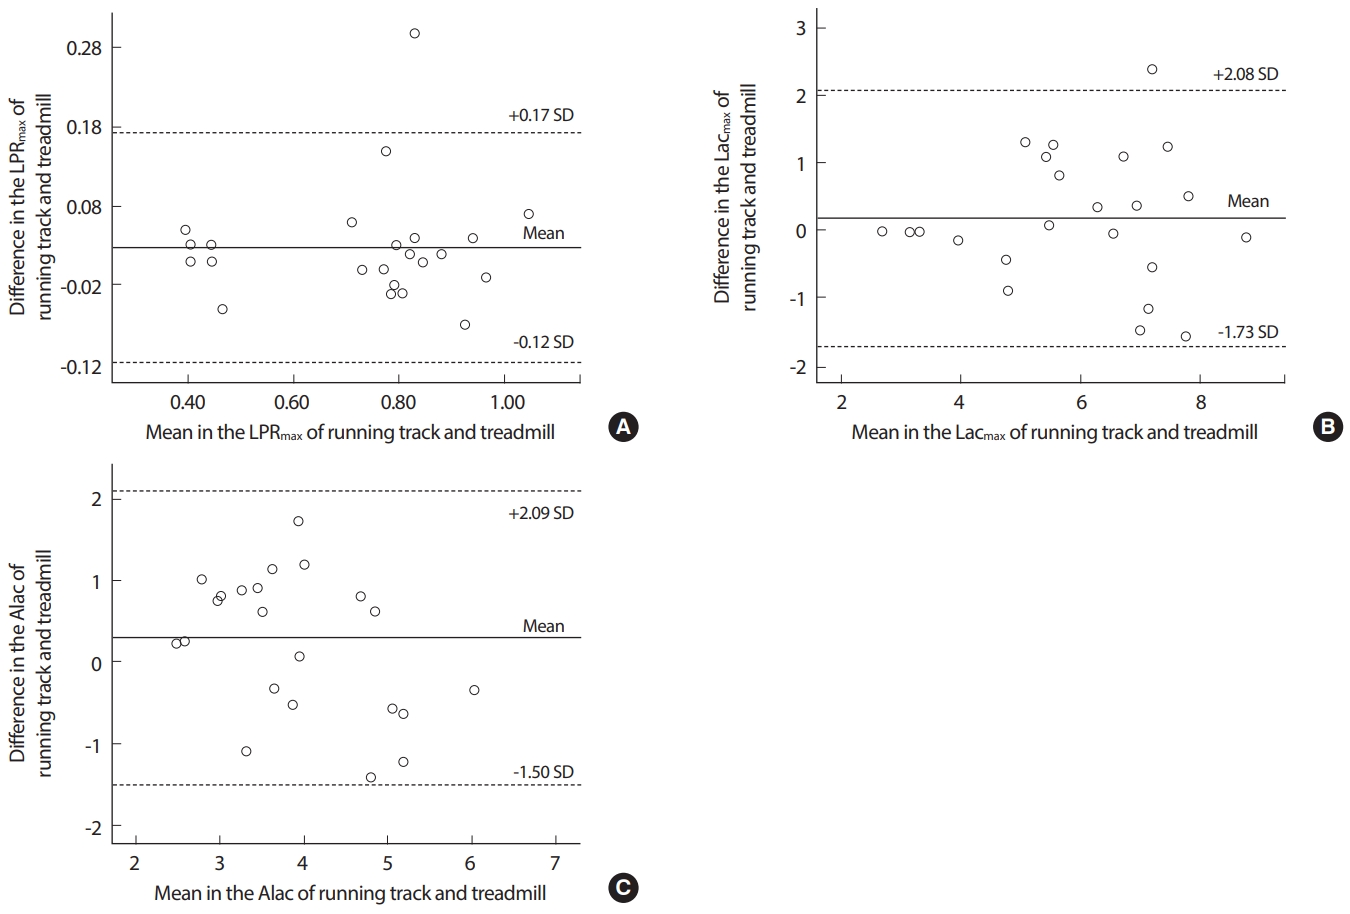
Bland-Altman plots for the part III (A) Difference and mean value between running track and treadmill in the LPRmax: maximal lactate production rate. (B) Difference and mean value between running track and treadmill in the Lacmax: maximal lactate. (C) Difference and mean value between running track and treadmill in the alact: alactic time. ICC, intra-class correlation; CI, confidence interval; CV, coefficient variance; SD, standard deviation.
DISCUSSION
To the best of our knowledge, this is the first study that investigated sprint run testing by using the maximum rate of lactate production to determine anaerobic capacity for physiological performance diagnostics. Once reliability and validity was ascertained the use of LPRmax as a key component was focused and assessed. The major result for LPRmax of part I and II showed high correlations for different tested times. Also, part III indicated high correlation between sprinting on running track and treadmill. It might be a useful diagnostic tool to complement athletic anaerobic performance.
Several studies investigating energy system contribution concerning the cycle sprint suggest that anaerobic ATP synthesis is provided by contributions from anaerobic glycolysis [4,23]. It is also shown that it is influenced from PCr degradation as well, since it is evident that PCr storages diminish as a result of preservation of muscle concentration of ATP [23]. Increase in lactate concentration leads to the conclusion that anaerobic glycolysis is activated during maximal sprints. Furthermore, glycolysis is important because PCr stores are only partly depleted during maximal sprints [24]. It is well known that the anaerobic alactic way of energy generation can only be used for a few seconds [3]. Afterwards glucose located in muscle glycogen will be consumed. In doing so lactate acid rises due to proton accumulation (H+) in stressed musculature. This results in metabolic acidosis that inhibits muscle contraction in cause of enzymatic suspension in acid milieu [17]. LPRmax is deemed to be the indicator for anaerobic lactic capacity and is dependent on duration of glycolysis [3,7,25]. This parameter, and its components, is therefore the most important when assessing reliability and validity of given testing protocols.
The results of sprint on running track displayed high correlation for LPRmax as a parameter to determine anaerobic capacity. There were low to high correlations between the different times of sprinting for anaerobic-alactic time. This finding is as expected as the phosphagen system (ATP-PCr) is predominant during anaerobic-alactic time. It is more affected by the composition of muscle fibres and its mechanism than by time of sprinting [4,19,20]. Monocarboxylate transporter (MCT) plays a crucial role in lactate distribution. In skeletal muscles, MCT1 and MCT4 are present and both isoforms have a fibre specific distribution. MCT1 is responsible for lactate assimilation and mainly existing in oxidative muscle fibres, while MCT4 is basically in glycolytic muscle fibres and relevant for lactate depletion [26,27].
In several studies, a higher quantity of fast twitch fibres was predominantly used by sprinters than endurance athletes. Additionally, this distribution and its characteristic is also a reason why sprinters reach their maximum power earlier. Thus, in the case of sprinters the time of lactate production is longer and more lactate is produced, and consequently have higher LPRmax [4,11,19,20].
There was a high correlation of maximal lactate levels used for calculation of LPRmax for the ten second running in part II of the study. Although alactic time influences LPRmax, its impact seems to be reduced by high correlations between maximal lactate level and resting lactate level. For twelve seconds running, the findings are similar. Concerning the low correlation for alactic time, subjects need different times until achieving maximum power.
There is a high correlation score for LPRmax, as well as a low CV in part III of the study. As LPRmax is defined as the most important parameter for anaerobic capacity for sprint running, therefore it indicates the running tests are valid. It must be mentioned, however, that previous studies have used different test designs for sprint running or determining LPRmax.
Popular are shorter sprints that are repeated multiple times in series, like 6×30 m or 3×60 m [3,8,9,12,24]. However, tests running 15 seconds or providing running distance are used to determine LPRmax [4,21,28]. Nevertheless, some of these either used fixed alactic time for LPRmax [3] or did use calculated alactic times but for cycling or other sports [3,21,29].
For further research, it is necessary to measure additionally peak oxygen uptake to identify energy system contributions. Furthermore, there should be a proof of sprint tests with series or/and with changes in direction. The shift in direction is a distinct character for team-game sports such as soccer, hockey, rugby, and basketball, and therefore relevant. We did not detect any gender differences, however, it might be useful to measure hormonal status and monitoring menstrual cycle especially in females. This is of high importance when comparing test outcomes from different seasonal point of times. In order to classify several types of athletes it is necessary to recruit athletes, exercising one specific discipline. The level of LPRmax detects these several types of athletes and its finding is useful for detailed training programs: at 100 m sprint whereas energy is dominantly covered from anaerobic way of energy generation, in contrast a marathon performance is limited by high aerobic metabolism [3,18].
CONCLUSION
For physiological performance diagnosticians, sprint tests to determine anaerobic capacity are an additional tool to appreciate an athlete’s performance level. It is evident that disparity in profiles of qualification level is revealed via different diagnostic tools. On the basis of the present results, we assume reliability and validity of a linear sprint run to assess anaerobic capacity via LPRmax. We suggest that the test design is a useful diagnostic tool to complement physiological performance diagnostics. As LPRmax was similar in test designs, LSRT and NMT, both can used to determine maximal anaerobic capacity. These test designs allow coaches and other professionals to assess the performance capacity of individual athletes which in turn directs future training.
Acknowledgements
This study was supported by the Institute of Cardiology and Sports medicine, Department of Preventive and Rehabilitative Sport Medicine, German Sport University Cologne and the Olympic Training Centre Rhineland, Cologne, Germany. The authors would like to thank subjects for their participation in this study, and all colleagues for participating in data collection and helpful suggestions.
The authors declare that there is no conflict of interest and that the experiments comply with the current laws of Germany, the country in which the study was performed. No external funding was received for this work.
Notes
No potential conflict of interest relevant to this article was reported.
AUTHOR CONTRIBUTION
Conceptualization: C Wawer, O Heine, HG Predel; Data curation: C Wawer; Methodology: C Wawer; Project administration: C Wawer, O Heine; Visualization: WH Yang; Writing - original draft: C Wawer; Writing - review & editing: O Heine, HG Predel, DS Park, WH Yang.