Relationship between Smartphone Use Time, Sitting Time, and Fitness Level in University Students
Article information

Trans Abstract
PURPOSE
The purpose of this study was to investigate the relationship of smartphone use time, sitting time, and fitness level in university students.
METHODS
The participants of this study were 237 healthy university students (157 males and 80 females) enrolled from 2017 to 2018. The smartphone use time was divided into three groups: 0-4, ≥4-10, and ≥10 hours, as was the sitting time: 0-4, 4-7, and ≥7 hours. Binary logistic regression was used to calculate the odd ratio (OR) and 95% confidence interval (CI) of the smartphone use time and sitting time for having low levels of fitness.
RESULTS
There were linear decreases in physical fitness levels across incremental smartphone use time and sitting time. Compared to the smartphone use time for 0-4 hours (reference), smartphone use time for the ≥4-10 hours (OR=2.498; 95% CI=1.007-6.197; p=.048) or the 10≥group (OR=3.516; 95% CI=1.228-10.064; p=.019) had significantly higher ORs of having lower fitness even after adjustments for age, sex, physical activity and percent body fat. Likewise, logistic regression analyses showed that those who had sitting time for ≥7 hours (OR=3.135; 95% CI=1.155-8.512; p=.025) had significantly higher ORs of having lower fitness even after adjustments for age, sex, physical activity, and percent body fat, as compared with those who had sitting time for 0-<4 hours.
CONCLUSIONS
The current finding suggest that the smartphone using time and sitting time were associated with having the risk of lower level of physical fitness in university students.
INTRODUCTION
With the recent rapid development in digital technology, the functions of the mobile phone have become increasingly diverse from being used to make just phone calls, and they are similar to that of a computer. Thus, the mobile phone users today can make phone calls, send and receive texts, play video games, and search the internet from anywhere and at any time.
Similar to many western countries, the smartphone usage rate in Korea was about 94% as of 2017, indicating that most people used it in their daily lives [1]. Smartphones can also be used constructively in terms of healthcare, and mobile applications can be utilized as a tool to prevent and treat chronic diseases. For example, exercise interventions using smartphones have been shown to reduce weight and increase fitness in overweight or obese adults [2]. According to a prior study, a mobile application can be used as a prophylactic and therapeutic method in patients with type II diabetes mellitus [3].
Although it can be used as a tool for health care, overusing of smartphone causes side-effects. For example, improper use of smartphones can cause anxiety, depression and sleep disorders [4]. Particularly, Kim et al. reported that young adults addicted to smartphones tend to have a decrease in physical activity, resulting in an increase in body fat and a decrease in muscle mass [5]. Furthermore, the use of mobile phones was reported to be similar to sedentary behavior [5,6].
The sedentary behavior refers to the state where energy consumption is ≤1.5 metabolic equivalents, which includes sitting, lying, or watching television [7]. Reduced physical activity or sedentary behavior not only reduces fitness, but also increases the risk of metabolic diseases such as obesity [8], hypertension, and hyperlipidemia, and has been shown to have a positive correlation with all-cause mortality. Recent studies reported that prolonged sitting times cause health problems even if the World Health Organization’s (WHO) recommendations on physical activities for health are followed [9]; hence, both physical activities and sitting time are considered independent risk factors affecting health outcomes [10,11].
High levels of fitness are a powerful independent factor that reduces the prevalence of metabolic syndrome, cardiovascular disease, and cancer, and delays all-cause mortality [12,13]. Moreover, the high level of fitness in youth has been reported to have a significant positive correlation with body composition and cardiovascular health once the person has reached adulthood [14]. High levels of fitness are reportedly influenced by both genetic and environmental factors, such as regular exercise, physical activities, and dietary habits [15]. Since today’s university students use mobile phones in learning and leisure time, and mobile phone use is related to sedentary behavior and is an environmental factor affecting the fitness of university students, it is necessary to study the effect of mobile phone use time on fitness.
Therefore, the purpose of this study was to investigate the relationship between smartphone use time, sitting time and physical fitness levels by measuring muscle strength, muscular endurance, flexibility, agility, and balance in university students.
METHODS
1. Participants
The participants of this study were 257 healthy university students (157 males and 80 females) enrolled from 2017 to 2018. All participants were fully informed of the study prior to participation, and they provided signed consent forms to participate in this study. After excluding 20 subjects with incomplete data such as body composition or questionnaire or physical fitness test, 237 healthy subjects were selected for data analysis. This study was conducted after approval from the Gyeongsang National University Institutional Review Board and in compliance with the research ethics (approval number: GIRB-A17-Y-0052).
2. Smartphone use time
Daily smartphone use time was obtained by following question: How many hours a day do you spend on using smartphone? [16] Statistical records of screening time presented on the smartphone were used. Explained to all participants how to check the screening time on their smartphones. After that, all participants checked and submitted their smartphone use time by themselves.
3. Body composition
Height, weight, body fat, and lean body mass were measured using Inbody (Biospace Co., Seoul, Korea). Body mass index (BMI) was calculated as body weight (kg)/height (m2). Waist circumference (WC) was measured midway between the iliac crest and the lowest rib cage. For the waist-to-hip ratio (WHR) was calculated by dividing the hip circumference with the waist circumference.
4. Physical activity and sitting time
The physical activity patterns of all participants were evaluated using the short-form international physical activity questionnaire (IPAQ). For each participant, the number of minutes of moderate intensity or high intensity exercise per week was calculated according to the IPAQ scoring manual. Physical activity was defined as a group fulfilling 150 minutes of moderate intensity exercise or 75 minutes of high intensity exercise criteria based on the WHO specifications.
5. Physical fitness test
As for the fitness test, muscle strength (grip strength), muscle endurance (sit-up), flexibility (sit and reach), agility (side step, Sargent jump test), and balance (one-leg standing) were measured. These tests are valid and reliable methods [17]. (Thompson WR, Gordon NF, Pescatello LS, editors. ACSM’s guidelines for exercise testing and prescription. Philadelphia: Wolter Kluwer; 2005).
The grip strength was measured with legs kept shoulder-width apart and hands left down in natural position, using the dynamometer (TANITA No. 6103, Tokyo, Japan) measuring twice each on the left and right, and the maximum value from the recorded measurements was used. For the sit-up exercise, the number of sit-ups performed in 2 minutes using the sit-up stand was calculated. For the sit and reach movement, the participant sat on a level ground and the distance by which the sit and reach box was moved in centimeters was recorded. For the side step test, the action of the participant standing at the centerline and jumping to the left and right by 30 cm each was counted as one repetition, and the number of repetitions performed in 1 minute was recorded. As for the Sargent jump, the participant stood with both feet on the ground, reached up as high as possible vertically with one hand, and marked the wall with the tips of the fingers, following which the participant jumped from a static position as high as possible and marked the wall. The difference between both these points was recorded. For the one-leg standing, the number of seconds that the participant could stand on one leg was measured.
All measures of fitness domains were converted into z-scores and added. The group with a total score ≥ 50% was categorized as the high-fitness group and the group with a total score < 50% was categorized as the low-fitness group.
6. Data analysis
Statistical analyses used the SPSS Statistics for Windows, Version 23.0 (IBM Corp., Armonk, NY, USA). All variables were confirmed normality and, if necessary, a log10 transformation before statistical analyses. General characteristics were compared using independent t-test for sex. The smartphone use time was divided into three groups: 0-4 hours; ≥4 -10 hours; >10 hours, as was the sitting time [18]: 0-4 hours; 4-7 hours; and 7 hours. General characteristics and fitness of the participants were compared using one-way ANOVA, and least significance difference test was used when the post hoc test was required. Binary logistic regression was used to calculate the risk of fitness deterioration according to the mobile phone use time and sitting time. All statistical significances were set at α< 0.05.
RESULTS
The characteristics of the male and female participants who participated in this study are shown in (Table 1). The proportion of female students was 35% and the mean ages of male and female students were 21.4 ±1.7 and 20.4 ±1.2 years, respectively. The male students had higher height (p< .001), weight (p< .001), BMI (p=.003), WHR (p=.013), and muscle mass (p< .001) than the female students, whereas the female students had higher percent body fat (p< .001), mobile phone use time (p< .001), and sitting time (p< .001) than the male students.
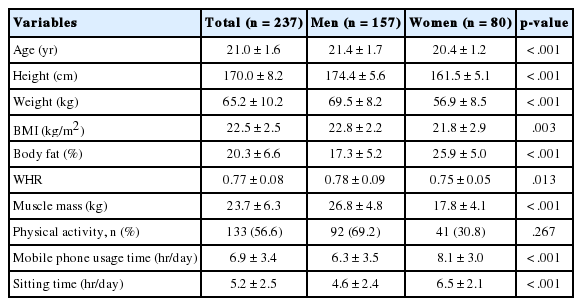
Physical characteristics of the participants mean±SD
Table 2 shows the results of comparing the measured parameters according to the smartphone use time. When the smartphone use time was divided into three groups as follows: 0-4 hours; ≥4-10 hours; >10 hours, the mean smartphone use time was 2.7±1.2, 7.6±1.3, and 11.1± 1.3 hours, respectively (p< .001). Age (p< .001), height (p< .001), weight (p< .001), WHR (p=.014), body fat (p=.012), and muscle mass (p< .001) showed statistically significant decrease as the mobile phone use time increased. The amount of body fat increased significantly as the mobile phone use time increased. In the case of fitness index, the parameters of grip strength (p< .001), sit-up (p< .001), side step (p< .001), and Sargent jump (p< .001) showed statistically significant decrease with increase in mobile phone use. In other words, the longer the mobile phone use time, the lesser was the muscle mass and level of fitness.

Comparison of measurement variables and physical fitness parameters according to smartphone use time
Table 3 shows the result of comparing the obesity index and fitness level according to the usual level of sedentary lifestyle. When the daily sedentary lifestyle was categorized into three groups as follows: <4 hours group; 4-7 hours group; and >7 hours group, the results of mean time spent sitting was 2.1±0.9, 5.0 ±0.8, and 7.8±0.4 hours, respectively (p< .001). Age (p< .001), height (p< .001), weight (p< .001), WHR (p= .002), and muscle mass (p< .001) showed statistically significant decrease as the sitting time of the day increased, and percent body fat (p< .001) increased significantly. The longer the sitting time, the lower was the percentage of those carrying out the amount of physical activities recommended by the WHO. In the case of fitness index, the grip strength (p< .001), sit-up (p< .001), side step (p< .001), and Sargent jump (p< .001) values showed statistically significant decrease as the sitting time increased.
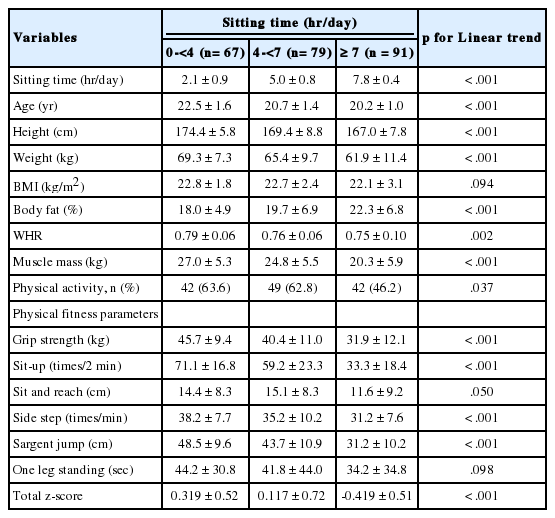
Comparison of measurement variables and physical fitness parameters according to sitting time
Using the binary logistic regression analysis, we calculated the risk of decreasing fitness according to the mobile phone use time and sitting time (Table 4). Compared to students using mobile phone for 0 - <4 group (reference group, OR =1), students using mobile phone for ≥ 4 - <10 group (OR = 4.590; CI =2.265-9.300; p< .001) or students using mobile phone for ≥10 group (OR= 8.840; 95% CI =3.861-20.238; p< .001) had significantly higher risks of fitness deterioration. When adjusted for age, sex and physical activity, the OR of lower fitness was attenuated but remained significant (OR=2.652; 95% CI =1.096-6.416; p=.030 for ≥4 - <10 group; and OR =3.728; 95% CI =1.336-10.400; p=.019 for ≥10 group). Moreover, after adjusting for age and sex, physical activity and percent body fatness as the mobile phone use time increased, the risk of fitness deterioration still significantly increased (OR =2.498; 95% CI =1.007-6.197; p=.048 for ≥4- <10 group; and OR =3.516; 95% CI = 1.228-10.064; p=.019 for ≥10 group).
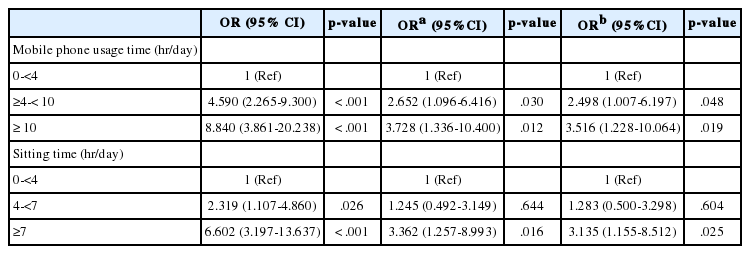
Odds ratio of poor fitness to mobile phone usage time and sitting time
Likewise, compared to sitting time for 0- <4 group (reference group, OR =1), sitting time for 4- < 7 group (OR =2.319; 95% CI =1.107-4.860; p=.026) and sitting time for ≥7 group (OR = 6.602; 95% CI =3.197- 13.637; p< .001) had significantly higher risks of fitness deterioration. When adjusted for age, sex and physical activity, the OR having lower fitness remained significant only sitting time for ≥7 group (OR=3.362; 95% CI =1.257-8.993; p=.016). Moreover, after adjusting for additionally percent body fatness, the risk of fitness deterioration still significantly increased in sitting time for ≥7 group (OR=3.135; 95% CI =1.155-8.512; p=.025).
DISCUSSION
In this cross-sectional study, we examined the relationship between fitness parameters and sitting time and mobile phone use time in 237 university students. The finding from our study showed that longer duration of smartphone usage and longer sitting time were linear decreases in physical fitness level. When subjects were categorized into the low risk and high risk groups for having low levels of fitness, increased time for smartphone use and sitting had statistically significant higher ORs of having lower fitness level even after adjusting for age, sex, physical activities and percent body fat.
The total score of fitness measured in this study reflects the general fitness level of each individual. The higher the score, healthier were the outcomes shown by the participants for the various fitness parameters analyzed. The combination and accumulation of the components of fitness reflects the health of young adults [19]. According to previous studies, fitness increases the sensitivity of insulin in young adult muscles to move the blood glucose quickly into the muscles, reducing the risk of diabetes [20,21]. Additionally, it was reported that fitness increased the lipase activity to promote clearance of blood triglycerides, and increased high-density lipid cholesterol that lowers the risk of cardiovascular diseases [22]. Therefore, the increase in fitness of youth is considered to be an important factor in reducing chronic diseases.
The results of this study showed that longer sitting time increased the risk of fitness deterioration, and this risk was significantly higher even after adjusting for age, sex, physical activities, and percent body fat. A similar previous study by Barlow et al. analyzed the relationship between prolonged sitting time and cardiorespiratory fitness in 4,658 males and 1,737 females enrolled in the Cooper Center longitudinal study. As per the results obtained for females, even if their physical activities satisfied the WHO-recommended physical activity guidelines, the increased sitting time and low cardiorespiratory fitness still showed a significant correlation [23]. Huang et al. conducted a cross-sectional study of the relationship between sitting time and fitness in 1,164 Chinese adolescents aged 8-19 years and found that there was a negative correlation between sitting time and fitness in both male and female students. The statistical significance persisted after the adjustment for age [24]. Similarly, television viewing, which is regarded as a typical sedentary behavior, had a negative correlation with cardiorespiratory fitness or maximum oxygen uptake in adolescents who watched television for >2 hours per day [25]. In other words, long sitting time, independent of the amount of physical activities, is considered to be an independent risk factor for fitness deterioration, which supports the findings of previous studies.
Furthermore, increased sitting time was reported to be associated with sedentary obesity [26], metabolic syndrome [27], type II diabetes mellitus [27,28], as well as decreased fitness. A study by Healy et al. [29] found that those watching TV for a prolonged time showed correlation with risk factors for metabolic syndrome, despite being active adults who met the WHO guidelines of moderate to high-intensity physical activities of >150 minutes per week [29]. Additionally, sitting time was measured for 169 adults (mean age 53.4 years) using an accelerometer to examine its correlation with risk factors of metabolic syndrome, and the results showed that sitting time had a correlation with waist circumference and risk factors of metabolic syndrome independent of the moderate to high-intensity physical activities [30]. Summarizing these results, it is undisputable that minimizing sitting time acts as an important factor in preventing chronic diseases caused by fitness deterioration as well as fitness deterioration itself.
Similar to the case of sitting time, prolonged smartphone use time showed statistically significant correlation with lower level of fitness. According to a previous study, the longer the mobile phone use time, higher was the positively correlation with the mobile phone use addiction, resulting in a negative impact on health [31]. Venkatesh et al. performed an analysis on 205 university students to examine the correlation between mobile phone use time and health-related factors. The results showed that longer mobile phone use time correlated with higher mental stress, lower physical activities, and higher BMI [32]. Similarly, Lemola et al. surveyed 362 adolescents about their use of smartphones, sleep patterns, and depression symptoms. The longer the smartphone use time, the shorter was the sleep time along with difficulty in sleeping in the young adults [33]. Comprehensive analysis of these previous studies indicates that prolonged use of smartphones would lead to decrease in physical activities and poor sleep quality, which is expected to affect obesity. Because obesity has negative correlation with fitness, this is expected to affect the fitness deterioration, both directly and indirectly [34].
As this study was of cross-sectional design, it could not verify the causal relationship between the effects of sitting time and mobile phone use time on university students’ fitness deterioration. Furthermore, sex differences could not be investigated because male and female students were not divided into sex-based categories. The physical activities and sitting time were measured using a questionnaire survey rather than by accelerometer, and this could be one of the major limitations of this study. In the future, interventional studies that have improved the limitations of this study should be conducted.
CONCLUSIONS
In this study, there was a negative correlation between the fitness of university students and the sitting time and mobile phone use time, which was shown to be significant after adjusting for age, sex, the presence of physical activities recommended by the WHO and body fat. Thus, mobile phone use time and sitting time are risk factors for fitness deterioration in young adults, suggesting the importance of managing physical activity patterns and mobile phone use time in maintaining the fitness of university students.
Notes
No potential conflict of interest relevant to this article was reported.
AUTHOR CONTRIBUTION
Conceptualization: JI Yoo, JS Kim; Data curation: J Cho; Formal analysis: J Cho; Methodology: KW Baek; Project administration: KW Baek; Visualization: MH Kim; Writing - original draft: JI Yoo; Writing - review & editing: JS Kim.