


INTRODUCTION
Postprandial hyperglycemia is associated with an increased risk of chronic complications in patients with type 2 diabetes (T2D) [1,2]. Ele-vated blood glucose levels 2 hours after lunch increased the risk of cardiovascular events by 50% and all-cause mortality by 89% [2]. Therefore, controlling postprandial hyperglycemia is an important strategy for pre-venting complications in patients with T2D.
Physical activity has long been considered as a key element in the prevention and treatment of T2D [3]. Several studies have demonstrated that postprandial exercise causes an acute reduction in postprandial hyperglycemia [4-6]. However, postprandial exercise does not always have similar effects on blood glucose levels. Our recent data suggest that a single bout of exergame after oral glucose load can improve hyperglycemia in patients with impaired glucose tolerance (IGT), but not in those with T2D [7]. To the best of our knowledge, even the same volume of exercise may have different effects on glucose response to exercise following meal or oral glucose load depending on diabetes duration, physical activity level, anthropometrics, and blood parameters. However, the factors influencing blood glucose response to exercise following meal or oral glucose load are not yet elucidated. Additionally, the optimal and individual prescription of aerobic exercise to reduce hyperglycemia following meal or oral glucose load has not yet been clearly understood.
The purpose of this study was to analyze the factors (diabetes duration, physical activity level, anthropometrics, and blood parameters) influencing glucose response to exercise following oral glucose load in patients with IGT and T2D.
METHODS
1. Participants
We enrolled 169 participants with IGT (59.7±10.0 years, n=64) and T2D (61.5±11.0 years, n=105) for this study. The physical characteristics and metabolic profiles of the participants are shown in Table 1. T2D was diagnosed when the fasting plasma glucose was either ≥126 mg/dL or hemoglobin A1c (HbA1c) was ≥6.5% or using oral hypoglycemic medications. IGT was diagnosed when the fasting plasma glucose level was 100-125 mg/dL or HbA1c was 5.7-6.4% [8]. Participants were excluded from the study if they had: uncontrolled hypertension (>160/100 mmHg), or cardiopulmonary disease, or an orthopedic disorder that cause physical inactivity. The use of insulin was set as exclusion criterion. Participants with T2D were being treated with oral hypoglycemic agents (glimepiride and pioglitazone (n=1); gliclazide (n=1); metformin, pioglitazone and alo-gliptin (n=1); metformin, pioglitazone, vildagliptin and acarbose (n=1); or metformin (n=101)). The Participants took their medications in the usual manner on the experimental days. Written informed consent was ob-tained from all participants before the study. This study was approved by the Institutional Review Board of Kosin University Gospel Hospital (IRB File No. 2016-06-029).
Table 1.
Baseline characteristics
| IGT (n=64) | T2D (n=105) | |
|---|---|---|
| Sex (M/F) | 25/39 | 47/58 |
| Age (years) | 59.7±10.0 | 61.5±11.0 |
| Weight (kg) | 68.3±12.1 | 68.3±14.3 |
| BMI (kg/m2) | 26.3±4.0 | 25.7±3.8 |
| Systolic BP (mmHg) | 136.4±17.8 | 133.7±15.6 |
| Diastolic BP (mmHg) | 75.3±8.9 | 72.1±7.2 |
| Current smoking, n (%) | 8 (12.5) | 12 (11.4) |
| Alcohol drinker, n (%) | 18 (28.1) | 23 (21.9) |
| Hypertension, n (%) | 47 (73.4) | 78 (74.3) |
| Dyslipidemia, n (%) | 39 (60.9) | 52 (49.5) |
| Diabetes duration (yr) | 4.9±6.3 | |
| Glucose (mg/dL) | 111.9±19.4 | 132.1±35.8*** |
| HbA1c (%) | 6.2±0.2 | 7.2±1.0*** |
| Insulin (µU/dL) | 14.5±17.6 | 22.1±34.8 |
| C-peptide (ng/mL) | 2.3±2.1 | 2.7±2.2 |
| HOMA-%β | 86.2±37.7 | 82.3±58.4 |
| HOMA-IR | 1.9±1.8 | 2.3±1.9 |
| Total METs | 2,879.4±3,724.1 | 2,217.5±3,169.2 |
| Sedentary time (hr) | 7.6±9.3 | 7.1±7.8 |
2. Anthropometrics measurements and physical activity level
The height and weight were measured using digital electronic scales and recorded to the first decimal place. The waist circumference was measured on the relaxed exhale at the center point between the iliac crest and lower rib while the subject was in a standing position with two feet spread shoulder width. The average of the two measurements was recorded. Body mass index (BMI) was calculated as weight divided by height in meters squared (kg/m2). The body composition was determined by measuring the bioelectric impedance using an InBody770 body composition analyzer (Biospace Co. Ltd., Seoul, Korea). The fat mass, %body fat, and fat-free mass were recorded for each participant.
The physical activity level was assessed through an interview using the International Physical Activity Questionnaire (IPAQ) [9]. The overall physical activity level was derived according to the IPAQ data processing guidelines, which enabled patients to be classified into three groups: low physical activity, moderate physical activity, and vigorous physical activity.
3. Clinical and laboratory assessments
Plasma blood glucose levels were measured using the hexokinase assay. Glycated hemoglobin (HbA1c) levels were determined using a DiaSTAT HbA1c analyzer (Bio-Rad, Hercules, CA, USA). Insulin and C-peptide concentrations were evaluated using chemiluminescence immunoassays. Pancreatic β-cell function was assessed by the measurement of fasting C-peptide levels. In addition, insulin resistance (HOMA-IR), β-cell function (HOMA-β) were computed by Homeostasis Model Assessment (http://www.dtu.ox.ac.uk/homacalculator/) to evaluate the β-cell function and insulin resistance, respectively, using fasting C-peptide and glucose levels in the plasma.
4. Oral glucose tolerance test
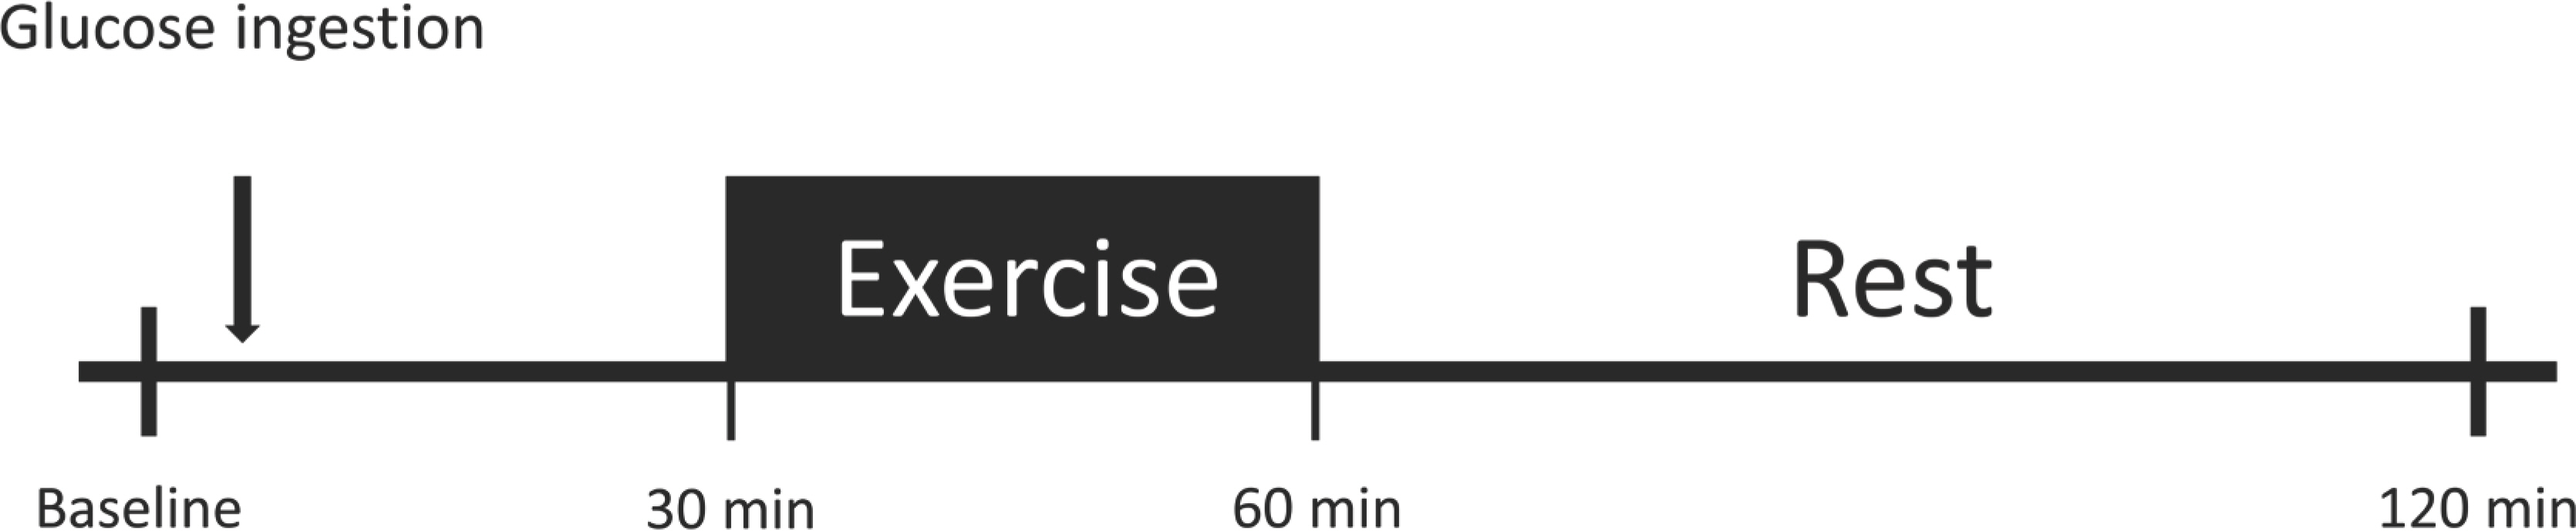
We used TrelanⓇ-G75 (Ajinomoto Pharmai Co. Ltd., Tokyo, Japan) instead of meals to avoid interference from other nutrients. The glucose beverage (225 mL) was within the standard range for adult humans and consumed within 5 minutes. The blood glucose levels were measured before the intervention at fasting (0 minute) and 30, 60, and 120 minutes after 75-g oral glucose ingestion (Fig. 1). The Glucose levels were measured using a hand blood glucose meter (OneTouch SelectⓇ Plus, Lifescan Eu-rope, Zug, Switzerland; coefficient of variation (CV)=2.52%) [10]. The ar-eas under the curve (AUC30-120) of glucose between 30 and 120 minutes was calculated using the trapezoid method [11].
5. Aerobic exercise
The aerobic exercise performed using the Exer Heart device (D&J Humancare, Seoul, Korea), which consisted of a running/jumping board and a screen connected to the board. Our recent data showed that a single bout of moderate-intensity exergames using Exer Heart following oral glucose load can reduce hyperglycemia [7]. In addition, exergames training using Exer Heart showed identical effects as vigorous-intensity traditional exercise on a treadmill through increases in cardiorespiratory fitness in high cardiovascular risk patients [12]. Therefore, in this study, Exer Heart device were used as aerobic exercise tools.
At 30 minutes after 75-g oral glucose ingestion, participants performed exergames for 30 minutes (Fig. 1). The exercise intensity was calculated using the heart rate reserve (HRR) method, which considers the resting HR and estimated maximal HR (calculated as 220 minus the participant's age), where HRR is the difference between the estimated maximal HR (corrected for age) and the resting HR. The exercise intensity was set at 40-60% of the HRR. We monitored the individual exercise intensity by monitoring the HR (Polar RS400sd; Madison Height, Michigan), and the rating of perceived exertion (RPE) during the exercise session was recorded. The participants were asked to maintain the exercise intensity during the entire session.
6. Statistical analysis
All quantitative data were expressed as means±standards error for descriptive statistical representation and comparison between groups was performed using the Student's t-test. Categorical data have been expressed as counts and proportions, and comparisons between groups were performed using the Chi-square t-test. Changes in glucose concentration over time were analyzed using a two-way repeated-measures ANOVA, which include fixed factors (group and disease duration) and subjects as random factors. Based on the AIC criterion, the correlation structures were selected for compound symmetry with different standard deviations per each time. For further analysis, a Post-hoc test was performed, and family wise type I errors were controlled using the Mul-tivariate test. For the analysis of factors affecting glucose control by postprandial exercise, a multiple linear regression was applied with AUC30-120 during the OGTT as a dependent variable and clinical factors as independent variables. All statistical analyses were performed using the nlme and emmeans libraries in the R statistical package. Critical values were set to p <.05 in all statistical analyses.
RESULTS
The characteristics of participants are presented in Table 1. Of the T2D (n=105), 78 participants (74.3%) had hypertension regulated within the normal range with antihypertensive medication, 52 participants (49.5%) used lipid-lowering drugs, 12 participants (11.4%) were current smokers, and 23 participants (21.9%) were alcohol drinkers. Of the IGT (n=64), 47 participants (73.4%) had hypertension regulated within the normal range with antihypertensive medication, 39 participants (60.9%) used lipid lowering drugs, 8 participants (12.5%) were current smokers, and 18 participants (28.1%) were alcohol drinkers. The anthropometric, metabolic-, and clinical characteristics of participants are presented in Table 1. As expected, there were several significant differences, especially a higher baseline fasting glucose and HbA1c levels, in the T2D group than in the IGT groups. Age, BMI, BP, and other blood parameters were similar between the groups.
Fig. 2 show the glucose response to exercise following oral glucose load in subjects with IGT and T2D. T2D patients had significantly higher glucose levels at 0, 30, 60, and 120 minutes than those with IGT (all p<.001). A two-way repeated-measures ANOVA revealed that the the glucose response to exercise following oral glucose load was significantly higher in T2D compared than in the IGT group (p<.001).
Fig. 2.
Fig. 2.Glucose response to aerobic exercise following oral glucose load in subjects with impaired glucose tolerance (IGT) and type 2 diabetes (T2D). Paired t-test showed that glucose level significantly higher in T2D than IGT at same time (*** p<.001). Two-way repeated measures ANOVA showed a significant effect of time and group in T2D and IGT (## p<.01).
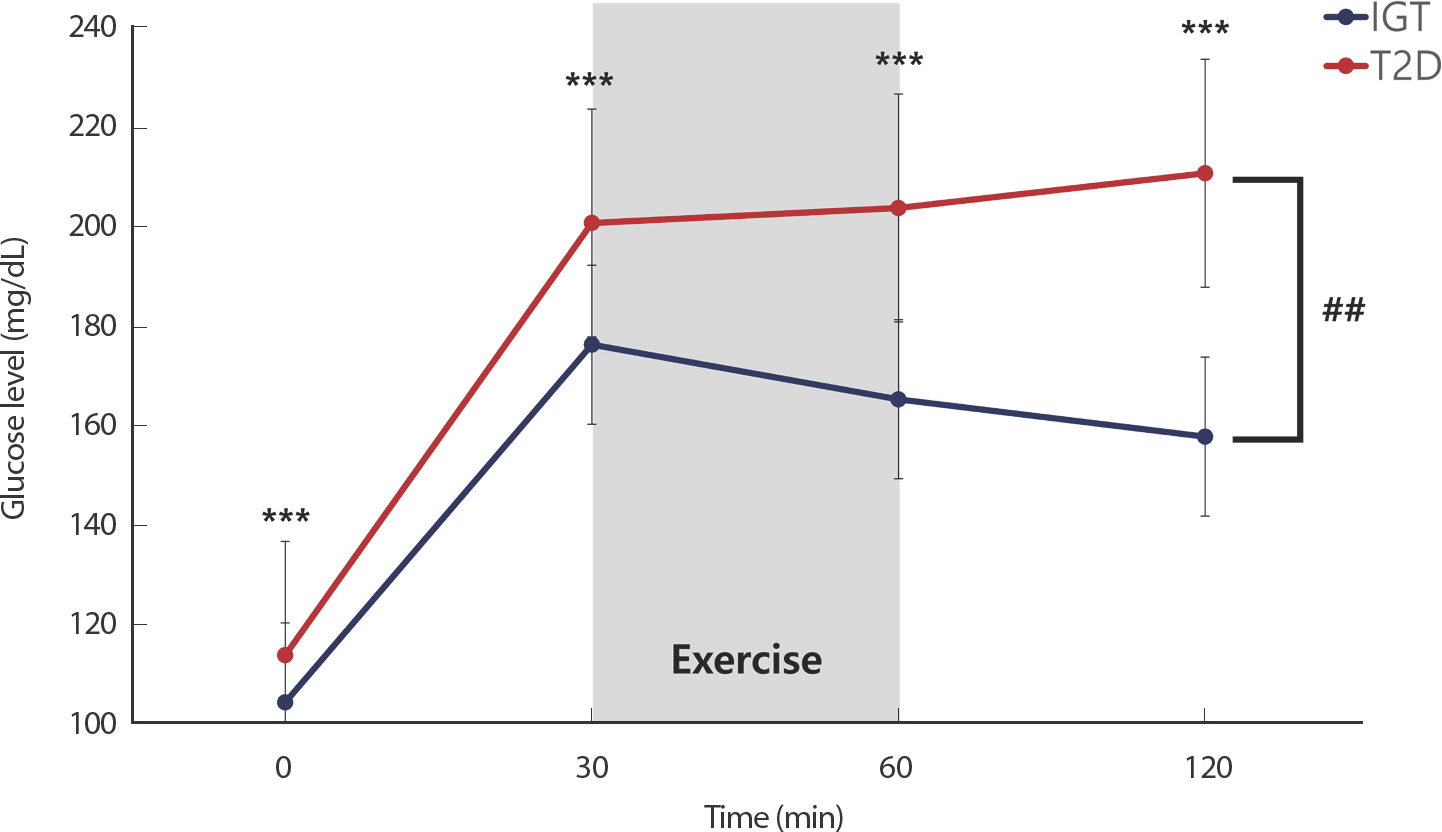
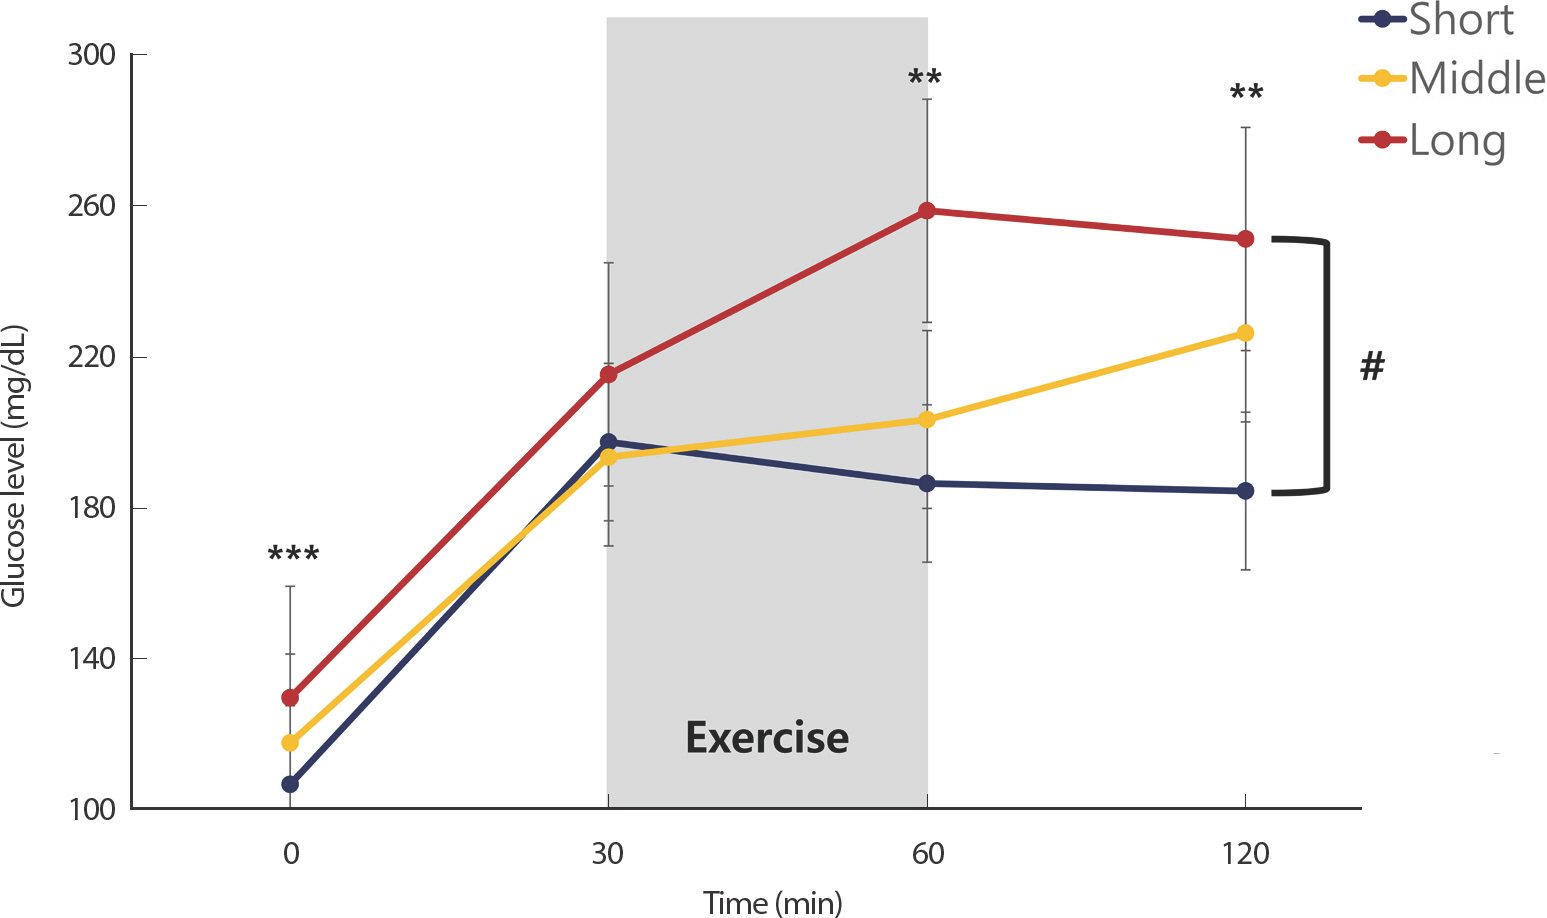
Fig. 3 shows the glucose response to exercise following oral glucose load according to the diabetes duration. Diabetes duration was categorized into levels of shorts (≤1 year), middle (1< and <10 years), and long (≥10 years) duration. Subjects with a long diabetes duration had significantly higher glucose levels at 0, 60, and 120 minutes than those with a short diabetes duration (p <.001, p =.001 and p =.003, respectively). A two-way repeated measures ANOVA revealed that the glucose response to exercise following oral glucose load was significantly higher in patients with a long diabetes duration than that in patients with a short diabetes duration (p <.001). However, there was no difference between the middle- and short-term pe-riods or in the duration of long diabetes duration.
Fig. 3.
Fig. 3.Glucose response to aerobic exercise following oral glucose load according to diabetes duration. Paired t-test showed that glucose level significantly higher in patients with long disease duration than that in patients with short disease duration at same time (** p<.01 and *** p<.001). Two-way repeated measures ANOVA showed a significant effect of time and group in patients with short and long disease duration (# p<.01).
We found that there were no differences between physical activity level in IGT and T2D group.
Table 2 shows multiple linear regression analysis of the association between AUC30-120 and selected variables in IGT and T2D. This result im-plied that waist circumference (β=.249, p =.035), visceral fat area (β=.811, p =.042), fasting glucose (β=.801, p =.003), HbA1c (β=.316, p =.022), and HOMA-IR (β=2.405, p =.003) affected glucose response to exercise following oral glucose load in T2D. In the IGT group, there was no factor that showed a statistically significant correlation.
Table 2.
Multiple linear regression analysis of the association between AUC30-120 and clinical factors
DISCUSSION
To the best of our knowledge, this is the first study to investigate the factors (diabetes duration, physical activity level, anthropometrics and blood parameters) influencing glucose response to exercise following oral glucose load in patients with IGT and T2D. The main finding of our study was that the glucose response to exercise following oral glucose load was higher in patients with T2D than in those with IGT and higher in patients with long diabetes duration than in those with short diabetes duration. Additionally, we found that higher waist circumference, visceral fat area, fasting glucose, HbA1c, and HOMA-IR associated with poor glucose control following exercise. Our study suggests that even if all patients are administered the same amount of glucose and perform the same volume of exercise, the glucose response would differ according to the presence of type 2 diabetes, disease duration, insulin resistance, anthropometrics and blood parameters.
It is well established that contraction rapidly activated glucose uptake in skeletal muscle by inducing translocation of glucose transporter 4 (GLUT4) to the cell surface [13,14]. It has been shown in human that glucose uptake is increased within 5 minutes [15,16], and reaches a near-maximum within 10 minutes after the start of exercise [17]. Importantly, exercise increases muscle-contraction-induced glucose uptake via insulin-independent GLUT4 translocation in human remain at normal levels in insulin-resistant conditions such as T2D and obesity [18-20]. These exercise-evoked mechanisms have been widely applied for acute amelioration of high blood glucose, particularly postprandial hyperglycemia. However, Knudsen et al. [21] who show that while a single bout of aerobic exercise immediately increases the postprandial glucose response in healthy subjects, oral glucose tolerance following exercise is preserved in subjects with IGT and T2D. Our recent data suggest that a single bout of aerobic exercise following oral glucose load improve hyperglycemia in patients IGT, but not in those with T2D [7]. Additionally, present study appeared to show that several factors may affected glucose response to exercise following oral glucose load.
β-cell function and insulin sensitivity deteriorates progressively with disease course in patients with T2D [22]. The Kingdom Prospective Diabetes Study (UKPDS) [23] reported a β-cell function decline rate of 5% per year in T2D. An incessant increase in the OGTT glucose response curve reflected reduced β-cell function [24]. Considering that the different OGTT glucose response curves indicate a differential risk for β-cell impairment, we postulated that a long disease duration with incessant increase in postprandial exercise glucose response curve would have significantly higher glycemic failure rates with a decline in the β-cell function. Studies on the association between disease duration and the postprandial exercise glucose response are limited. Our results showed that a normal volume of acute aerobic exercise following oral glucose load made it difficult to control hyperglycemia in patients with a long disease duration.
However, the present study shows that there was no correlation between β-cell function and glucose response. Yinhui et al. [25] reported that an extended disease course of T2D was associated with progressive deterioration of β-cell secretion function. Nevertheless, the disease course did not exert as strong an effect as the HbA1c level on islet β-cell function. In a recent study, researchers followed T2D patients negative for islet auto-antibodies for 20 years and found no signs of significant decline in the islet β-cell function in these patients [26]. This was likely due to the recov-ery of islet dedifferentiation after glycemic control [27]. Therefore, it is rea-sonable to suggest that better management of blood glucose level is more important than disease duration, and even if the disease course is extended, blood glucose management through regular exercise can prevent β-cell dysfunction.
In T2D, various pathological issue contribute to elevated blood glucose levels, such as impaired insulin production caused by decreased β-cell ac-tivity and insulin resistance [28]. Especially, insulin resistance is a prima-ry event in the progression to T2D [29]. The fact that moderate exercise is sufficient to improve the glucose response to a meal is well-known. A single bout of exercise can independently enhance muscle insulin-stimulated glucose uptake [30]. However, in this study, exercise appeared to be insuf-ficient in significantly reducing glucose response to exercise following oral glucose load in patients with T2D. Interestingly, glucose was significantly higher in the older adult compared to the younger adult one hour after the high-fat meal [31]. Present study indicates that patients with older adult more difficult to control glucose response to postprandial exercise. Also, this may be performing 30 minutes of exercise did not have affected the glucose response over the two hours after oral glucose load in patients with older adult.
We found a positive correlation between the HbA1c level and glucose response to postprandial exercise. High postprandial or post-load glucose levels are attributable to reduced insulin secretion rather than insu-lin-resistance [32]. HbA1c levels are more significantly affected by the postprandial blood glucose levels than by fasting glucose levels, especially in subjects with HbA1c levels<7.3% [33]. As most study participants were non-diabetic or diabetic subjects exhibiting good glycemic control (a mean HbA1c level of 7.1%), compromised insulin secretion may have caused the observed high glucose levels and increased the HbA1c levels, as evident in the oral glucose tolerance test (OGTT).
We found that a larger waist circumference and visceral fat area, independent of skeletal muscle mass and physical activity level, are associated with poor glucose control. The independent roles of waist circumference and visceral fat area are important because they are modifiable, and therefore may play a role in the prevention of postprandial hyperglycemia. Although no studies have analyzed the correlation between postprandial exercise effects and anthropometric parameters, several studies have shown that excess total fat mass and its distribution are strongly associated with insulin resistance, glucose intolerance, and an increased risk of T2D and cardiovascular disease [34-36]. For example, higher fat mass and lower skeletal muscle mass are associated with insulin resistance in musculoskeletal ageing [37] and is associated with a risk of IGT/impaired glucose tolerance in the general population [38].
Low levels of PA and more sedentary behavior have repeatedly been associated with insulin resistance and impaired glucose homeostasis [39-41]. Moreover, engaging in some forms of exercise following a meal is ef-fective in mitigating postprandial hyperglycemia and assisting with daily glycemic control in overweight and obese adults [42-44]. In this study, PA and sedentary behavior were not associated with glucose response to postprandial exercise. This may be because measuring physical activity using a questionnaire instead of an accelerometer seemed to have reduced objectivity in deriving statistical correlations. patients in this study were mostly overweight and sedentary.
We were unable to analyze the correlation with metabolic syndrome components due to the lack of lipid profile measurements. However, some studies have indicated that patients with 1-hour OGTT glucose levels ≥155 mg/dL exhibit increased levels of insulin and a higher prevalence of metabolic syndrome components. Some studies have shown that patients with 1-hour OGTT glucose levels ≥155 mg/dL have increased levels of insulin and a higher prevalence of metabolic syndrome components [45-47]. Also, glucose level during the OGTT have a significantly higher probability of having metabolic syndrome and other car-diometabolic risk conditions in subjects with IGT [48].
The present study had several limitations. First, the sample size of the IGT group was significantly smaller than that of the T2D group and there were no control groups or sessions. Second, we measured the blood glucose levels from fingertips during assessment of glucose response to postprandial exercise. The presence of a control group and measurements of venous blood glucose and insulin levels responses would have helped interpret the findings more precisely. Third, we estimated the exercise intensity based on the HRR and not on maximal oxygen uptake. However, the assessment of exercise intensity using heart rate is easier to implement in many subjects. Finally, the measurement of PA was conducted using a questionnaire instead of an accelerometer. Further studies are needed to more closely investigate the relationship between sedentary behavior, PA and glucose response to exercise, which may ulti-mately benefit the development and implementation of more personal-ized interventions. In addition, randomized crossover studies on the effects of individual exercise therapy on postprandial blood glucose levels considering patient characteristics, such as diabetes duration and obesity are needed.
CONCLUSIONS
Numerous studies have demonstrated that postprandial exercise causes an acute reduction in postprandial blood glucose in T2D [4-6]. However, our study shows that a single bout of aerobic exercise following oral glucose load does not have equal reduction of glucose concentration in all patients with IGT and T2D. The presence of T2D, disease duration, insulin resistance, waist circumference, visceral fat area, and fasting blood glucose and HbA1c are determinants for glucose response to exercise following oral glucose load in patients with T2D. This is an exciting finding given that anthropometrics and blood parameters are modifiable and safe strategies for reducing hyperglycemia following oral glucose load. This study provides a future perspective for designing exercise-based treatments for the optimal and individual prescription of aerobic exercise to reduce hyperglycemia following meal or oral glucose load.


